Loading [Contrib]/a11y/accessibility-menu.js
Skip to main content
null
Findings
  • Menu
  • Articles
    • Energy Findings
    • Resilience Findings
    • Safety Findings
    • Transport Findings
    • Urban Findings
    • All
  • For Authors
  • Editorial Board
  • About
  • Blog
  • covid-19
  • search

RSS Feed

Enter the URL below into your favorite RSS reader.

http://localhost:46283/feed
Transport Findings
September 26, 2024 AEST

The Association Between Streetscape and Surrounding Environment and Pedestrian Crashes on Urban Arterials

Chia-Yuan Yu,
pedestrian safetyurban arterialbuilt environmentland use
Copyright Logoccby-sa-4.0 • https://doi.org/10.32866/001c.123905
Findings
Yu, Chia-Yuan. 2024. “The Association Between Streetscape and Surrounding Environment and Pedestrian Crashes on Urban Arterials.” Findings, September. https:/​/​doi.org/​10.32866/​001c.123905.
Save article as...▾
Download all (1)
  • Figure 1
    Download

Sorry, something went wrong. Please try again.

If this problem reoccurs, please contact Scholastica Support

Error message:

undefined

View more stats

Abstract

This study examines the association between road geometry, land uses, access points, and streetscape environments with pedestrian-vehicle crashes (2018-2020) on urban arterials in Austin, Texas, using negative binomial models. This study assessed streetscape environments using a computer vision approach driven by machine learning algorithms and Google Street View (GSV) images. The results showed that arterials with high posted speed limits were associated with increased numbers of total, fatal, and injurious crashes. Traffic-generating uses (i.e., commercial and office uses) were associated with increased pedestrian-vehicle collisions. Arterials abundant in green spaces were linked to a reduced number of total and fatal crashes.

1. Questions

Urban arterials play a crucial role in shaping traffic flow in metropolitan areas, acting as connectors between high-speed highways and local streets (Arias et al. 2021). While designed for speed and capacity, these roads often compromise pedestrian safety and comfort (Gitelman et al. 2017; Golakiya, Patkar, and Dhamaniya 2019). Although some research has addressed pedestrian safety on urban arterials, gaps remain regarding the effects of land use, driveways, and streetscape environments. This study focuses on the relationship between road geometry, land uses, driveways, and streetscapes and pedestrian safety in Austin, Texas, aiming to inform better urban planning and traffic safety strategies.

2. Methods

Austin, Texas was chosen as the study area due to its rapid urban growth, diverse streetscape environments, and various urban development patterns. Street-level data was obtained from the Texas Department of Transportation (TxDOT). The unit of analysis is street segment. To account for road geometry variability, arterial roads were divided into unequal segments based on the stretch between two intersections. This method ensured each segment had consistent geometric characteristics, minimizing bias in the analysis. A total of 923 segments were selected, with an average length of 0.61 kilometres (0.38 miles) (standard deviation of 0.63 kilometres [0.39miles]) and a range from 0.09 to 6.15 kilometres (0.06 to 3.82 miles). The study analyzed three years of crash data (2018-2020) from TxDOT, focusing on mid-block crashes to assess the association between land use and crash occurrences along the segments. The focus on mid-block pedestrian crashes is due to the distinct risk factors and characteristics of these locations, which differ from intersections. Mid-block areas often lack traffic control devices and involve less predictable pedestrian behavior, leading to unique interactions between pedestrians and vehicles. This study excluded those pedestrian-vehicle crashes occurred within 50-meter buffer from the intersections of two arterials since a previous study has used a 50-meter buffer to explore the effects of characteristics within close proximity to the intersection on crashes (Miranda-Moreno, Morency, and El-Geneidy 2011).

The dependent variables were pedestrian-vehicle crashes categorized by injury severity (fatal and injurious). This study excluded the no-injury category, as most of such crashes are typically unreported. 677 pedestrian-vehicle crashes were recorded along Austin’s urban arterials (Table 1). The crash data showed over-dispersion and fit a negative binomial distribution (Table 2).

Table 1.The numbers and percentages of pedestrian-vehicle crashes with different levels of injury severity
Number Percentage
Fatal crashes 32 5.17%
Injurious crashes 587 94.83%
Total pedestrian-vehicle crashes 619 100%

Data source: Texas Department of Transportation (2018-2020)

Table 2.Tests for negative binomial distribution
Total pedestrian crashes Fatal pedestrian crashes Injurious pedestrian crashes
Test of negative binomial distribution (H0: No over-dispersion issue)
Arterial segments
(N=923)
Ratio of variance to mean 314.19 3.55 301.97
alpha 0.75 1.89 0.69
Likelihood-ratio test of alpha 2312.19 1020.90 1644.97
p-value <0.001 <0.001 <0.001

Table 3 details these variables, including their measures, data sources, time periods, and descriptive statistics. The dependent variables were pedestrian-vehicle crashes by injury severity (fatal and injurious). Four independent variable domains were considered—traffic/pedestrian exposure, road geometry, surrounding environment, and streetscape—based on existing literature. To accurately capture the surrounding environment, 30.48-meter (100-foot) buffers were created around each arterial segment. This buffer size was chosen based on design standards from the Federal Highway Administration (Texas Department of Transportation, 2013), its adequacy in encompassing nearby land uses, and its ability to minimize overlap and spatial autocorrelation.

Table 3.Dependent and independent variables and their measurements, data sources, and time periods
Variable Measurement Data source Descriptive statistics
Dependent variables
Total pedestrian crashes Number of pedestrian-vehicle collisions (2018-2020) Texas Department of Transportation (2018-2020) Mean:1.11
S.D.a:8.43
Fatal pedestrian crashes Number of pedestrian-vehicle collisions with fatalities (2018-2020) Mean:0.26
S.D.a:2.56
Injurious pedestrian crashes Number of pedestrian-vehicle collisions with injuries (2018-2020) Mean:0.79
S.D.a:7.45
Independent variables
Traffic/pedestrian exposure
Average daily traffic Average daily traffic for each street segment Texas Department of Transportation (2018) Mean:2009.56
S.D.a:7.76
Street segment length Continuous (kilometers) Mean:0.61
S.D.a:0.62
Population density Total population / buffer area (hectare) Census Bureau (2020) Mean:2.64
S.D.a:1.37
Employment density # of employed population / buffer area (hectare) Mean:6.54
S.D.a:4.43
Average number of boarding-and-alighting Average number of boarding-and-alighting for transit stop for each street segment Cap Metro (2018) Mean:22.58
S.D.a:72.01
Road geometric characteristic
Lane width Average width (in meter) of lanes for each street segment Texas Department of Transportation (2018) Mean:3.44
S.D.a:0.44
Median width Width (in meter) of the median for each street segment Mean: 2.91
S.D.a:2.54
Shoulder width Width (in meter) of the shoulder of each street segment Mean:1.59
S.D.a:0.98
Number of lanes Number of lanes in each street segment (through lane only) Mean:5.14
S.D.a:1.24
Posted speed limit Continuous (kilometers per hour) Mean:69.60
S.D.a:20.17
Midblock crosswalk Number of crosswalks in each street segment Mean:0.15
S.D.a:3.02
Surrounding environment along arterial
Number of driveways # of driveways in each street segment Texas Department of Transportation (2018) Mean: 0.95
S.D.a:1.35
Non-motorized infrastructure
Sidewalk completeness (Sidewalk length) / (street length × 2) City of Austin (2018) Mean:0.43
S.D.a:0.56
Bike lane completeness (Bike lane length) / (street length × 2) Mean:0.26
S.D.a:0.17
Transit service
Transit stop # of transit stops / length of street segment (in meter) Capital Metro (2018) Mean:0.99
S.D.a:1.11
Land use
Residential use type Residential area / buffer area around each segment (hectare) City of Austin (2018) Mean:0.21
S.D.a:0.09
Commercial use type Commercial area / buffer area around each segment (hectare) Mean:0.03
S.D.a:0.03
Industrial use type Industrial area / buffer area around each segment (hectare) Mean:0.02
S.D.a:0.02
Office use type Office area / buffer area around each segment (hectare) Mean:0.02
S.D.a:0.03
Streetscape environment
Sidewalk pavement [Number of paved sidewalk pixels / (Number of road pixels + Number of paved sidewalk pixels)] × 100 Google Street View (2018-2020) Mean:10.75
S.D.a:6.35
Greenery [Number of street vegetation pixels/Total number of pixels] × 100 Mean:5.32
S.D.a:5.01
Openness [Number of sky pixels/Total number of pixels] × 100 Mean:25.32
S.D.a:4.28

a Standard deviation

This study evaluated the streetscape environments using a computer vision approach powered by machine learning algorithms and Google Street View (GSV) images. Deep neural network-based semantic segmentation models were employed to extract information from the vast GSV image data (Kwon and Cho 2020; Wang et al. 2016). DeepLabv3 semantic segmentation model was used to analyze GSV images, extracting streetscape features like sidewalks, greenery, and road surfaces. This computer vision approach, powered by convolutional neural networks (CNNs), allowed for a detailed analysis of how these streetscape elements relate to pedestrian-vehicle crashes. Points were generated every 20 meters along urban arterials, and 215,988 GSV panorama images were retrieved via the GSV API, focusing on those captured between 2018 and 2020. Ultimately, 174,867 GSV images were utilized to analyze visual streetscape environments.

GSV panorama images offer a 360° view but have edge distortions that can cause inaccuracies (Yin and Wang 2016). To improve accuracy, the study focused on the central portion with minimal distortion (Kim and Woo 2022) and trimmed the distorted segments based on established methods, processing the corrected images into study variables using a semantic segmentation approach (Figure 1).

Figure 1
Figure 1

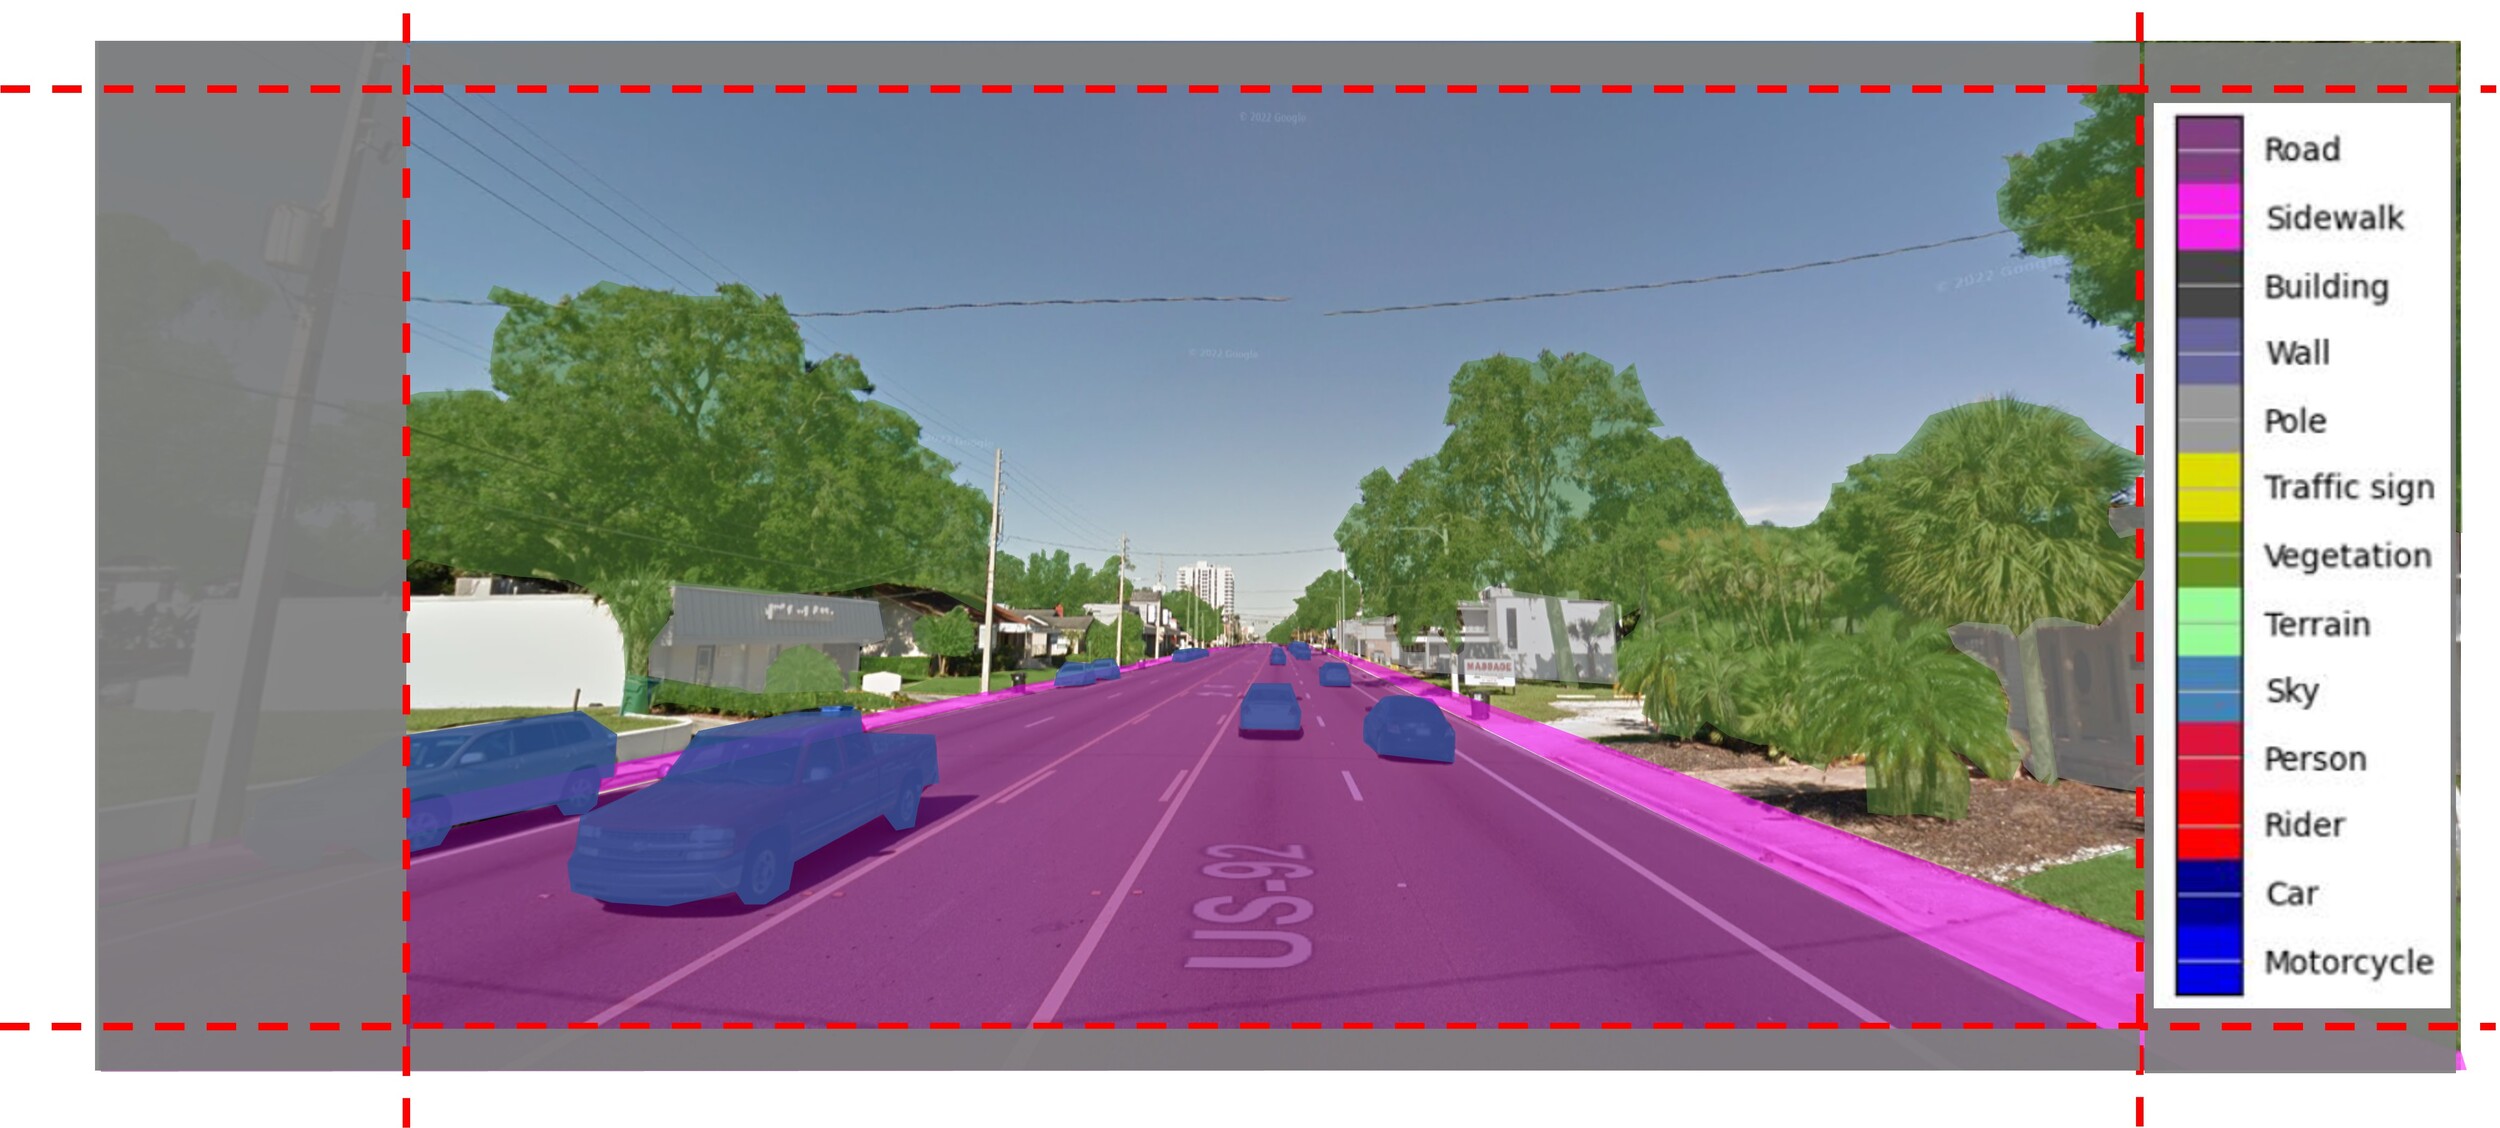
The Deeplab V3+ model, trained on the Cityscapes dataset, achieved a validation accuracy of 0.825 in identifying street-level landscape features (Xia, Yabuki, and Fukuda 2021). The model analyzed GSV images to identify elements such as roadways, sidewalks, greenery, sky, and more, focusing on greenery, sidewalk pavement, and outdoor openness. Categories like persons, vehicles, and buildings were excluded due to their transient nature and potential for data skew, as well as multicollinearity concerns (Zhanjun et al. 2022). Emphasizing greenery, sidewalk pavement, and openness is crucial for understanding their relationship with pedestrian safety: greenery enhances aesthetics and visibility, sidewalks reduce fall risks, and openness improves sightlines, decreasing potential hazards (Jeon and Woo 2023). The study averaged these variables across street segments to evaluate their effects on pedestrian safety.

Negative binomial models were used to address over-dispersed dependent variables (Ukkusuri et al. 2012). Four models were developed to explore the relationships between independent variables and the counts of total, fatal, injurious, and no-injury pedestrian-vehicle crashes. Correlation tests and Variance inflation factors (VIF) checked for multicollinearity, with all analyses conducted in Stata 12.0.

3. Findings

Table 4 displays the coefficients from the negative binomial models predicting total, fatal, and injurious pedestrian-vehicle crashes. It shows the relationship between four independent variable domains and pedestrian-vehicle crashes by injury severity (fatal and injurious), respectively.

Table 4.Coefficients of the final models predicting total, fatal, and injurious pedestrian-vehicle crashes
Variable Total pedestrian crashes Fatal pedestrian crashes Injurious pedestrian crashes
Coefficients 95% CIs Coefficients 95% CIs Coefficients 95% CIs
Traffic/pedestrian exposure
Average daily traffic 0.005** 0.003-0.008 0.004* 0.002-0.006 0.006* 0.003-0.009
Street segment length (kilometers) 0.005* 0.002-0.008 0.004* 0.002-0.007 0.005* 0.002-0.008
Population density (hectare) 0.002* 0.001-0.004 0.002* 0.001-0.004 0.003* 0.001-0.004
Employment density (hectare) 0.001 -0.003-0.005 0.001 -0.002-0.005 0.001 -0.002-0.004
Average number of
boarding-and-alighting
0.001 -0.002-0.004 0.001 -0.002-0.005 0.001 -0.003-0.005
Road geometric characteristic
Lane width (meter) -0.002 -0.003-0.001 -0.002 -0.005-0.001 -0.001 -0.004-0.002
Median width (meter) -0.005* -0.008- -0.002 -0.004* -0.007- -0.001 -0.003 -0.006-0.001
Shoulder width (meter) -0.001 -0.004-0.003 -0.002 -0.006-0.002 -0.002 -0.004-0.001
Number of lanes 0.004* 0.002-0.006 0.005* 0.002-0.008 0.003* 0.001-0.005
Posted speed limit (kilometers per hour) 0.003** 0.001-0.006 0.007** 0.004-0.010 0.003* 0.001-0.005
Midblock crosswalk -0.002 -0.004-0.001 -0.001 -0.004-0.002 -0.001 -0.003-0.001
Surrounding environment along arterial
Number of driveways 0.003* 0.001-0.004 0.001 -0.002-0.003 0.002* 0.001-0.004
Non-motorized infrastructure
Sidewalk completeness -0.004* -0.007- -0.001 -0.003* -0.007--0.002 -0.003* -0.006--0.002
Bike lane completeness -0.001 -0.004-0.003 -0.001 -0.005-0.003 -0.001 -0.004-0.002
Transit service
Transit stop (meter) 0.004* 0.002-0.007 0.004* 0.001-0.008 0.005* 0.002-0.008
Land use
Residential use type (hectare) 0.001 -0.003-0.005 0.001 -0.002-0.005 0.001 -0.003-0.004
Commercial use type (hectare) 0.006** 0.001-0.010 0.003** 0.001-0.005 0.004** 0.002-0.007
Industrial use type (hectare) 0.001 -0.003-0.004 0.001 -0.003-0.005 0.001 -0.001-0.003
Office use type (hectare) 0.001 -0.002-0.004 0.001 -0.002-0.003 0.004* 0.002-0.006
Streetscape environment
Sidewalk pavement -0.003* -⁠0.005⁠-⁠ -⁠0.001 -0.002* -⁠0.004⁠-⁠ -⁠0.001 -0.003* -⁠0.005⁠-⁠ -⁠0.001
Greenery -0.004* -0.007- -0.001 -0.003* -0.006- -0.001 -0.001 -0.004-0.002
Openness 0.001 -0.002-0.004 0.001 -0.003-0.005 0.001 -0.001-0.002
Constant 3.001** 2.612-3.225 3.002** 2.828-3.296 1.532** 1.028-2.087
Log–likelihood -6328.012 -5869.867 -4352.002
N 923 923 923

*p<0.05, **p<0.01
95% CIs: 95% Confidence Intervals

Driveway, transit Stop, and land use

The number of driveways was significantly associated with total and injurious pedestrian crashes, aligning with prior research that identifies driveways as high-conflict zones and potential hotspots for pedestrian-vehicle crashes (Gattis et al. 2013). Commercial and office uses were identified as significant land use variables related to pedestrian collisions. They attract more vehicle and pedestrian traffic, increasing crash risks at driveway access points (Yu and Zhu 2016). Commercial sites near arterial roads with high vehicle accessibility may cause conflicts due to speed differences between vehicles on the road and those entering or exiting the commercial area. This can lead to insufficient time for drivers to decelerate or accelerate, raising crash risks. A 1% increase in transit stop density was associated with 0.4%, 0.4%, and 0.5% increases in total, fatal, and injurious pedestrian-vehicle crashes, respectively. Transit stops, as focal points for pedestrian activity, may expose users to heavy traffic, particularly on urban arterials (Cinnamon, Schuurman, and Hameed 2011).

Streetscape Environments

The presence of sidewalk pavement was found to be negatively associated with total, fatal, and injurious pedestrian-vehicle crashes, indicating that sidewalks help reduce crash occurrences by keeping pedestrians separated from traffic. Streets with higher percentages of greenery were also linked to fewer total and fatal pedestrian-vehicle crashes. Greenery, such as trees and shrubs, can calm traffic by creating a narrower visual corridor or signaling to drivers that they are in residential or recreational areas where caution is needed (Chiang et al. 2022).

A limitation of this study is the use of the DeepLabv3 model, which achieved a validation score of 0.825. While generally good, this suggests about 17.5% of streetscape features may have been misclassified, potentially introducing uncertainty into the analysis. Future studies should improve model accuracy or use manual verification to enhance the reliability of the findings.

Submitted: August 27, 2024 AEST

Accepted: September 24, 2024 AEST

References

Arias, D., D. Ederer, M. O. Rodgers, M. P. Hunter, and K. E. Watkins. 2021. “Estimating the Effect of Vehicle Speeds on Bicycle and Pedestrian Safety on the Georgia Arterial Roadway Network.” Accident Analysis & Prevention 161:106351.
Google Scholar
Chiang, Y. C., R. A. Ke, D. Li, and P. Y. Weng. 2022. “Greening and Safety: The Influence of Road Greenness on Driver’s Attention and Emergency Reaction Time.” Environment and Behavior 54 (9–10): 1195–1226.
Google Scholar
Cinnamon, J., N. Schuurman, and S. M. Hameed. 2011. “Pedestrian Injury and Human Behaviour: Observing Road-Rule Violations at High-Incident Intersections.” PloS One 6 (6): e21063.
Google Scholar
Gattis, J. L., J. S. Gluckm, J. M. Barlow, R. W. Eck, W. F. Hecker, and H. S. Levinson. 2013. “Considering and Applying Driveway Design for All Users.” Transportation Research Record: Journal of the Transportation Research Board 2348:38–46.
Google Scholar
Gitelman, V., R. Carmel, F. Pesahov, and S. Chen. 2017. “Changes in Road-User Behaviors Following the Installation of Raised Pedestrian Crosswalks Combined with Preceding Speed Humps, on Urban Arterials.” Transportation Research Part F: Traffic Psychology and Behaviour 46:356–72.
Google Scholar
Golakiya, H. D., M. Patkar, and A. Dhamaniya. 2019. “Impact of Midblock Pedestrian Crossing on Speed Characteristics and Capacity of Urban Arterials: Civil Engineering: Transportation Engineering.” Arabian Journal for Science and Engineering 44:8675–89.
Google Scholar
Jeon, J., and A. Woo. 2023. “Deep Learning Analysis of Street Panorama Images to Evaluate the Streetscape Walkability of Neighborhoods for Subsidized Families in Seoul, Korea.” Landscape and Urban Planning 230:104631.
Google Scholar
Kim, S., and A. Woo. 2022. “Streetscape and Business Survival: Examining the Impact of Walkable Environments on the Survival of Restaurant Businesses in Commercial Areas Based on Street View Images.” Journal of Transport Geography 105:103480.
Google Scholar
Kwon, J. H., and G. H. Cho. 2020. “An Examination of the Intersection Environment Associated with Perceived Crash Risk among School-Aged Children: Using Street-Level Imagery and Computer Vision.” Accident Analysis & Prevention 146:105716.
Google Scholar
Miranda-Moreno, L., P. Morency, and A. El-Geneidy. 2011. “The Link between Built Environment, Pedestrian Activity and Pedestrian-Vehicle Collision Occurrence at Signalized Intersections.” Accident Analysis and Prevention 43 (5): 1624–34.
Google Scholar
Texas Department of Transportation,. 2013. “Roadway Design Manual.”
Ukkusuri, S., L. F. Miranda-Moreno, G. Ramadurai, and J. Isa-Tavarez. 2012. “The Role of Built Environment on Pedestrian Crash Frequency.” Safety Science 50 (4): 1141–51.
Google Scholar
Wang, X., J. Yang, C. Lee, Z. Ji, and S. You. 2016. “Macro-Level Safety Analysis of Pedestrian Crashes in Shanghai, China.” Accident Analysis & Prevention 96:12–21.
Google Scholar
Xia, Y., N. Yabuki, and T. Fukuda. 2021. “Development of a System for Assessing the Quality of Urban Street-Level Greenery Using Street View Images and Deep Learning.” Urban Forestry & Urban Greening 59:126995.
Google Scholar
Yin, L., and Z. Wang. 2016. “Measuring Visual Enclosure for Street Walkability: Using Machine Learning Algorithms and Google Street View Imagery.” Applied Geography 76:147–53.
Google Scholar
Yu, C., and X. Zhu. 2016. “Planning for a Safe School: Impacts of School Siting and Surrounding Environments on Traffic Safety.” Journal of Planning Education & Research 36 (4): 476–86.
Google Scholar
Zhanjun, H. E., Z. Wang, Z. Xie, L. Wu, and Z. Chen. 2022. “Multiscale Analysis of the Influence of Street Built Environment on Crime Occurrence Using Street-View Images.” Computers, Environment and Urban Systems 97:101865.
Google Scholar

This website uses cookies

We use cookies to enhance your experience and support COUNTER Metrics for transparent reporting of readership statistics. Cookie data is not sold to third parties or used for marketing purposes.

Powered by Scholastica, the modern academic journal management system