Loading [Contrib]/a11y/accessibility-menu.js
Skip to main content
null
Findings
  • Menu
  • Articles
    • Energy Findings
    • Resilience Findings
    • Safety Findings
    • Transport Findings
    • Urban Findings
    • All
  • For Authors
  • Editorial Board
  • About
  • Blog
  • covid-19
  • search

RSS Feed

Enter the URL below into your favorite RSS reader.

http://localhost:26648/feed
Urban Findings
October 01, 2024 AEST

Assessing the Impact on Gentrification of Senate Bill (SB) 375 Streamlining: Case Study of Sacramento, CA

Graham DeLeon, Jamey M. B. Volker, Susie Pike, Bailey Affolter,
Senate Bill (SB) 375California Environmental Quality ActTransit-Oriented DevelopmentSacramentoEnvironmental Review Streamlining
Copyright Logoccby-sa-4.0 • https://doi.org/10.32866/001c.123769
Findings
DeLeon, Graham, Jamey M. B. Volker, Susie Pike, and Bailey Affolter. 2024. “Assessing the Impact on Gentrification of Senate Bill (SB) 375 Streamlining: Case Study of Sacramento, CA.” Findings, September. https:/​/​doi.org/​10.32866/​001c.123769.
Save article as...▾
Download all (2)
  • Figure 1. Map of Sacramento City with project site indicated by red boxes with project name in bold.
    Download
  • Figure 2. Percentage point change in socio-demographics (race, ethnicity, and bachelor’s degree) of workers in each project location’s Census Tract before and after the construction
    Download

Sorry, something went wrong. Please try again.

If this problem reoccurs, please contact Scholastica Support

Error message:

undefined

View more stats

Abstract

This study investigates whether the development streamlining provisions in California’s Senate Bill 375 (2008) – which reduce the review required under the California Environmental Quality Act for qualifying transit-oriented development (TOD) projects – contribute to gentrification. Gentrification can have positive and negative outcomes for nearby communities, including the disproportionate displacement of marginalized communities of color and low-income residents (Drexel University Urban Health Collaborative (UHC) 2019). We use case studies of three TOD projects in Sacramento that utilized SB 375 streamlining. We find medium evidence of gentrification from all three projects, with the Sacramento Commons project showing the most signs of gentrification.

1. Questions

Governor Arnold Schwarzenegger signed the Sustainable Communities and Climate Protection Act (SB 375) in 2008. SB 375 mandates that the California Air Resources Board set greenhouse gas (GHG) emissions reduction targets for each of the state’s 18 metropolitan planning organizations (MPO), and requires each MPO to adopt a plan (“sustainable communities strategy”) to achieve those targets through coordinated transportation and land use planning (California Government Code § 65080(b)(2)). SB 375 incentivizes housing development near transit hubs to achieve the targets by streamlining the environmental review process for transit-oriented development (TOD) projects under the California Environmental Quality Act (SACOG 2023). However, while TOD might reduce GHG emissions, it might also foster gentrification by attracting wealthier residents and businesses to the area, potentially displacing existing residents and businesses (Chapple and Loukaitou-Sideris 2019; Robert F. Smith Staff writers 2023). This study investigates whether three TOD projects in Sacramento, CA, that utilized SB 375 streamlining led to gentrification.

2. Methods

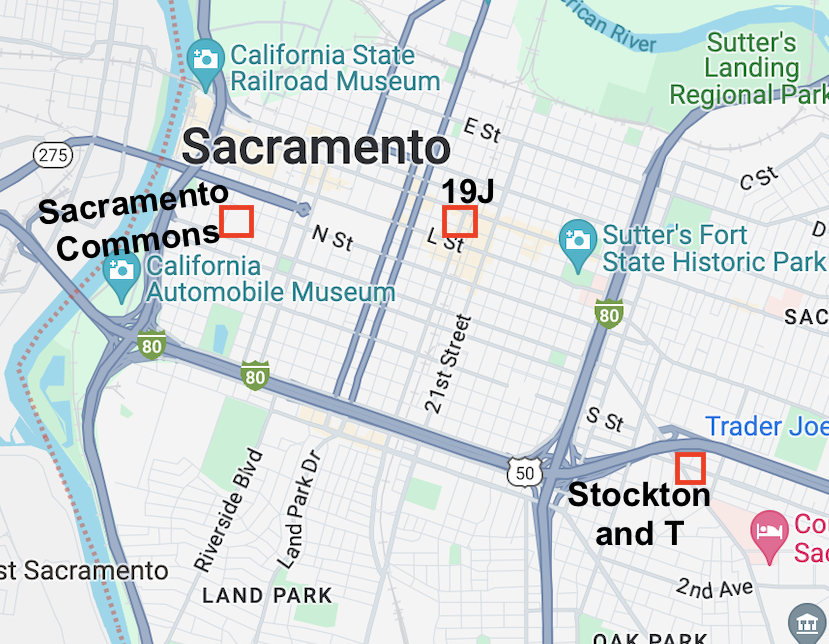
We focus on Sacramento because it is one of California’s largest and fastest-growing cities and because it is one of the only cities where multiple TOD projects have utilized SB 375 streamlining (Affolter et al. 2024). We examine three Sacramento TOD projects shown in Figure 1: Sacramento Commons, Stockton & T, and 19J. Sacramento Commons redeveloped the Capitol Tower’s Garden apartments – previously “the second largest source of affordable housing serving moderate to middle-income households in the city’s core” – to create denser apartments, hotels, and retail spaces starting in 2019 (Planning and Design Commission 2015). Stockton & T repurposed an empty AT&T office building into apartments, single-family housing, and retail space with construction beginning in 2018. 19J converted a vacant building into affordable-by-design apartments and retail space starting in 2017.

Figure 1
Figure 1.Map of Sacramento City with project site indicated by red boxes with project name in bold.

We explore the projects’ effects on gentrification using the five indicators shown in Table 1 – three sociodemographic indicators, a measure of business change, and a measure of residents’ concerns about gentrification.

Table 1.Gentrification Indicator, Measurement, Data Source, and Research Reference for all indicators used to determine gentrification in the project’s Census Tract. “New high-end developments” are defined in our study as two or more dollar signs on Google Maps.
Indicator: Measurement Subcategories: Data Sources: Previous Studies Using Similar Indicators:
Race and Ethnicity Increase in White and Asian percentages

Decrease in Black and Latino/Hispanic percentages
Census American Community Survey (ACS) 5-year estimates Cohen and Pettit (2019); Desmond and Shollenberger (2015); Mujahid et al. (2019); Rucks-Ahidiana (2021); Sutton (2020); and Feder (2020)
Housing Financial Character Household Income

Home Value

Median gross rent
Census American Community Survey (ACS) 5-year estimates Cohen and Pettit (2019); Mujahid et al. (2019); Chapple and Loukaitou-Sideris (2019); and Vashi (2019)
Worker Sociodemographics Worker race and ethnicity

Worker level of education
Longitudinal Employer-Household Dynamics (LEHD) data (accessed via the On the Map tool) Cohen and Pettit (2019), Liu and Shi (2020), Desmond and Shollenberger (2015), Mujahid et al. (2019), Chapple and Loukaitou-Sideris (2019), and Kilkenny (2017)
Business Change Number of high-end businesses Google Maps for visual assessment and City of Sacramento Database of Business and Operation Tax Information for business start date Cohen and Pettit (2019), Liu and Shi (2020), Desmond and Shollenberger (2015), Mujahid et al. (2019), Chapple and Loukaitou-Sideris (2019), and Kilkenny (2017)
Existing Residents’ Concerns of Gentrification Comments related to gentrification Recordings or transcripts of Planning and Design Commission Meetings for Sacramento, CA Cohen and Pettit (2019)

For the sociodemographic indicators, we examine the projects’ respective Census tracts before and after each project’s construction. We also compare the tract-level changes with corresponding trends across the entire city – one indication of project-generated gentrification is where a project’s neighborhood exhibits greater gentrification trends than the city as a whole after construction. This “multilevel” approach – both analyzing tract-level changes and comparing them to citywide trends – is common in gentrification studies (Cohen and Pettit 2019, 8). The dates of the baseline (2016-2018) and after-construction (2021) data are listed in Table 3. We use tract-level data from the year before each project started construction because the knowledge of forthcoming development can itself spur gentrification. All post-construction data is from 2021, which was the latest data available at the time of our analysis. One limitation of using ACS 5-year data is that the data is averaged over a 5-year period, which can mask year-to-year changes. However, we used sufficiently long pre-post periods for each project (between four and six years) to reduce data overlap.

As in prior studies, we assess the statistical significance of tract-level sociodemographic shifts before and after the development using the Census Bureau Statistical Analysis Tool, which provides a Z-score analysis with a standard 90% confidence level (Cohen and Pettit 2019; United States Census Bureau 2022). For the third indicator, our analysis is restricted to percentage point changes because the Longitudinal Employer-Household Dynamics (LEHD) data lacks margins of error (US Census Bureau Center for Economic Studies 2024).

We categorize evidence of gentrification for the sociodemographic indicators as none, slight, medium, or significant, based on the statistical significance (where possible), magnitude, and direction of the changes in the tract, and (where possible) comparison to citywide changes. Table 2 outlines the grading rules for race ethnicity and financial characteristics indicators. For example, in Sacramento Commons, although the White population in the project tract rose, the contrast with a citywide decline in the White population indicates medium evidence of gentrification. We use a similar process for grading the third indicator (worker sociodemographics), albeit without the statistical significance criteria.

Table 2.Decision rules for evaluating the level of evidence of gentrification.
Level of Evidence Description
Significant evidence When both the tract and city indicators show a statistically significant change, with the tract following a gentrification pattern, while the city shows a statistically significant change in the opposite direction.
Medium evidence When the indicator in the tract shows a gentrification pattern (statistically significant or not), while the city shows a change in the other direction.
Slight evidence When at least one indicator in the tract shows a gentrification pattern greater in magnitude than the corresponding change at the city level.
No evidence When none of the above apply, tract indicators show either an equivalent gentrification pattern to the city, less gentrification pattern than citywide, or that gentrification is reducing in both the city and the tract.

For the fourth indicator (business change), we use a simple decision rule – slight evidence of gentrification is indicated where more high-end businesses (≥2 dollar signs on Google Maps) existed at the time of analysis than before project construction. We also use a simple decision rule for the fifth indicator (existing resident concerns) – slight evidence of gentrification is indicated where existing residents voiced fears of gentrification in the transcripts of the city’s Planning and Design Commission meetings for each development.

We assign to each project the highest gentrification level estimated across all indicators (and their subcategories).

3. Findings

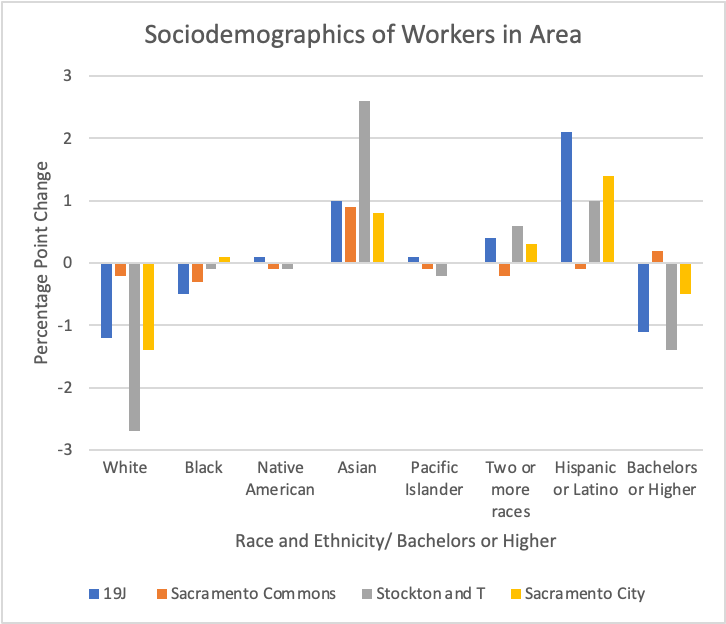
The results of our indicator analysis are displayed in Table 3 and Figure 1 (worker sociodemographics).

Table 3.Gentrification Indicator Results.
Sacramento Commons Stockton and T 19J Sacramento City
Race and Ethnicity
(Percentage point change from before and after construction)
Medium evidence: Tract 8 Medium evidence: Tract 17.01 Medium evidence: Tract 17.02 Medium evidence: Tract 11.02 Medium evidence: Tract 11.03 Control against which project changes are compared
Population Before Construction (2018) Percentage Point Change (2018-2021) Population Before Construction (Tract 17; 2017) Percentage Point Change (2017-2021) Percentage Point Change (2017-2021) Population Before Data (Tract 11.01; 2016) Percentage Point Change (2016-2021) Percentage Point Change (2016-2021) Population Before any Projects Constructed (2016) Percentage Point Change (2016-2021)
White 1,321 +3.2 4,232 -15.4 -1.3 1,556 -9.6 -10.9 240,603 -8.8
Black 126 -2.5 102 -0.2 +0.2 234 -6.5 +9.8 66,329 -0.3
Native American 0 +3.4 34 -0.6 -0.2 44 -0.8 -2 3,304 +0.1
Asian 151 -6.1 558 +10.3 -3.1 168 +0.2 -0.5 89,292 +0.6
Native Hawaiian or Other Pacific Islanders 0 0 0 0 0 0 0 +1.3 7,321 +0.3
Some Other Race 29 +0.8 194 +3.7 -0.2 118 +4.9 -0.9 45,507 +3
Two or More Races 76 +1.4 184 +2.1 +4.5 92 +11.7 +3.2 32,174 +5.1
Hispanic or Latino 171 +8.8 747 +18.4 -5.3 310 +19 +4 136,351 +0.8
Financial Characteristics
(Dollar Values)
No evidence Slight evidence: Tract 17.01 No evidence: 17.02 Slight evidence: 11.02 No evidence: 11.03
Median Gross Rent 1,469 +210 907 +521 -330 746 +668 +287 1057 +377
Median Income 59,318 -15203 56,776 No data +3746 27,472 +24555 +10952 80,254 +19003
Business Change Slight evidence: Increase 1 more than historically No evidence: Follows the historical trend No evidence: Follows the historical trend
Existing Resident Concerns of Gentrification Slight evidence: Residents expressed concern about increased housing costs No evidence: Residents expressed no concern No evidence: Residents expressed no concern

Color code: Purple = No evidence, Blue = Slight evidence, Red = Medium evidence, Orange = Significant evidence. No data means that the Census Bureau did not have data for that indicator for the tract likely due to a small population or another factor. The bolded values mean statistically significant using the 90% confidence level of the US Census Bureau Tool.

Figure 2
Figure 2.Percentage point change in socio-demographics (race, ethnicity, and bachelor’s degree) of workers in each project location’s Census Tract before and after the construction

Sacramento Commons

We find medium evidence of gentrification from the Sacramento Commons project, with the race and ethnicity indicator showing the most evidence of gentrification. For race and ethnicity, the share of White residents increased in the project’s Census tract while decreasing citywide. Concurrently, the share of Black residents, and those identifying as either an “other” race or two or more races increased less or decreased more in the tract than across the city as a whole. From a community perspective, existing community members expressed concern about displacement, especially of low- and middle-income residents, since Capitol Tower (which the Sacramento Commons project replaced) provided middle-income housing. Another indicator of possible gentrification is the increase in the share of workers with bachelor’s degrees while citywide decreases. That also coincided with three new high-end businesses opening, which can indicate gentrification.

Stockton and T

We also find medium evidence of gentrification from the Stockton and T project, with the race and ethnicity indicator again showing the most evidence of gentrification. Tract 17.01 shows a gentrification pattern for people identifying as two or more races and Asian, meanwhile tract 17.02 shows a gentrification pattern for people identifying as White, “other” race, and Hispanic or Latino. The financial characteristics in tract 17.01 also show slight evidence of gentrification with the median gross rent increasing more than citywide. The sociodemographics of workers had mixed results with the percentage of White workers decreasing (not indicative) while Asian workers increased (indicative).

19J

We similarly find medium evidence of gentrification from the 19J project, with the race and ethnicity indicator again showing the most evidence of gentrification. In tract 11.02 there was a greater decline in Black residents than citywide. Meanwhile, tract 11.03 shows a gentrification pattern for Native Americans, “other” races, and two or more races. Financial characteristics also show slight evidence of gentrification in tract 11.02, with the median gross rent and income increasing more than citywide.

Our analysis suggests that all three projects resulted in some level of gentrification, with a medium degree of evidence. Sacramento Commons has the most indicators of gentrification, possibly due to the project requiring the demolition of existing housing, which could have led to higher rent and consequently displacement, a concern of community members. Overall, our findings suggest that TOD can correlate with gentrification, but the effects can be mixed and difficult to identify. Given the varied influence of TOD projects on gentrification, planners and policymakers should consider these implications when developing TOD projects.


Acknowledgments

We would like to acknowledge and thank the NCST for their support and the NCST Undergraduate Fellowship Summer of 2023 which provided the funding and opportunity to conduct this research project.

Submitted: April 17, 2024 AEST

Accepted: September 19, 2024 AEST

References

Affolter, Bailey, Jamey M. B. Volker, Nicholas Marantz, Susan Pike, and Graham Deleon. 2024. “Fast-Tracking Transit-Oriented Development: Exploring the Efficacy of Environmental Impact Review Streamlining in California’s Senate Bill 375.” Working paper.
Chapple, Karen, and Anastasia Loukaitou-Sideris. 2019. Transit-Oriented Displacement or Community Dividends? Urban and Industrial Environments. Massachusetts Institute of Technology. https:/​/​doi.org/​10.7551/​mitpress/​11300.001.0001.
Google Scholar
Cohen, Mychal, and Kathryn L. S. Pettit. 2019. “Guide To Measuring Neighborhood Change To Understand And Prevent Displacement.” Urban Institute.
Desmond, Matthew, and Tracey Shollenberger. 2015. “Forced Displacement From Rental Housing: Prevalence and Neighborhood Consequences.” Demography 52 (5): 1751–72. https:/​/​doi.org/​10.1007/​s13524-015-0419-9.
Google Scholar
Feder, Sandra. 2020. “Stanford Professor’s Study Finds Gentrification Disproportionately Affects Minorities.” Stanford News (blog). December 1, 2020. https:/​/​news.stanford.edu/​2020/​12/​01/​gentrification-disproportionately-affects-minorities/​.
Kilkenny, Katie. 2017. “A Brief History of the Coffee Shop as a Symbol for Gentrification.” Pacific Standard, July 25, 2017. https:/​/​psmag.com/​economics/​history-of-coffee-shop-as-symbol-for-gentrification.
Liu, Jenny, and Wei Shi. 2020. “Understanding Economic and Business Impacts of Street Improvements for Bicycle and Mobility – A Multicity Multiapproach Exploration.” TREC Final Reports, April. https:/​/​doi.org/​10.15760/​trec.248.
Google Scholar
Mujahid, Mahasin S., Elizabeth Kelley Sohn, Jacob Izenberg, Xing Gao, Melody E. Tulier, Matthew M. Lee, and Irene H. Yen. 2019. “Gentrification and Displacement in the San Francisco Bay Area: A Comparison of Measurement Approaches.” International Journal of Environmental Research and Public Health 16 (12): 2246. https:/​/​doi.org/​10.3390/​ijerph16122246.
Google Scholar
Planning and Design Commission. 2015. “3.P14-012 Sacramento Commons.” Sacramento, CA.
Robert F. Smith Staff writers. 2023. “Gentrification Pros and Cons: A Double-Edged Sword.” Robert F. Smith. August 8, 2023. https:/​/​robertsmith.com/​gentrification-pros-and-cons/​.
Rucks-Ahidiana, Zawadi. 2021. “Racial Composition and Trajectories of Gentrification in the United States.” Urban Studies 58 (13): 2721–41. https:/​/​doi.org/​10.1177/​0042098020963853.
Google Scholar
Sacramento Area Council of Governments. 2023. “SB 375.” 2023. https:/​/​www.sacog.org/​planning/​land-use/​housing/​ceqa-streamlining/​sb-375.
Sutton, Stacey. 2020. “Gentrification and the Increasing Significance of Racial Transition in New York City 1970–2010.” Urban Affairs Review 56 (1): 65–95. https:/​/​doi.org/​10.1177/​1078087418771224.
Google Scholar
United States Census Bureau. 2022. “Statistical Testing Tool.” December 8, 2022. https:/​/​www.census.gov/​programs-surveys/​acs/​guidance/​statistical-testing-tool.html.
United States Census Bureau, Center for Economic Studies, Longitudinal Employer-Household Dynamics (LEHD). 2024. “OnTheMap.” https:/​/​lehd.ces.census.gov/​.
Vashi, Sonam. 2019. “How Do Researchers Measure Gentrification?” SaportaReport. May 9, 2019. http:/​/​saporta-newspack.newspackstaging.com/​how-do-researchers-measure-gentrification/​main-slider/​sonam-vashi/​.

This website uses cookies

We use cookies to enhance your experience and support COUNTER Metrics for transparent reporting of readership statistics. Cookie data is not sold to third parties or used for marketing purposes.

Powered by Scholastica, the modern academic journal management system