1. Questions
Walkable environments significantly impact urban residents’ quality of life (Yu 2015). A walkable neighborhood reflects residents’ feelings, shaped by visual information. Pedestrians understand streetscapes through visual metaphors of street elements (Yin and Wang 2016). Eye-level walkable environments are crucial for walking behavior. Advances in deep learning and computer vision allow measurement of environmental elements at eye-level using GSV panoramic image data, providing three-dimensional meso-scale walkable environment information (Cai et al. 2022). This study aims to answer the question regarding how changes in physical attributes (e.g., street greenery, sidewalk pavement, and outdoor openness) relate to walkability in downtown Orlando.
2. Methods
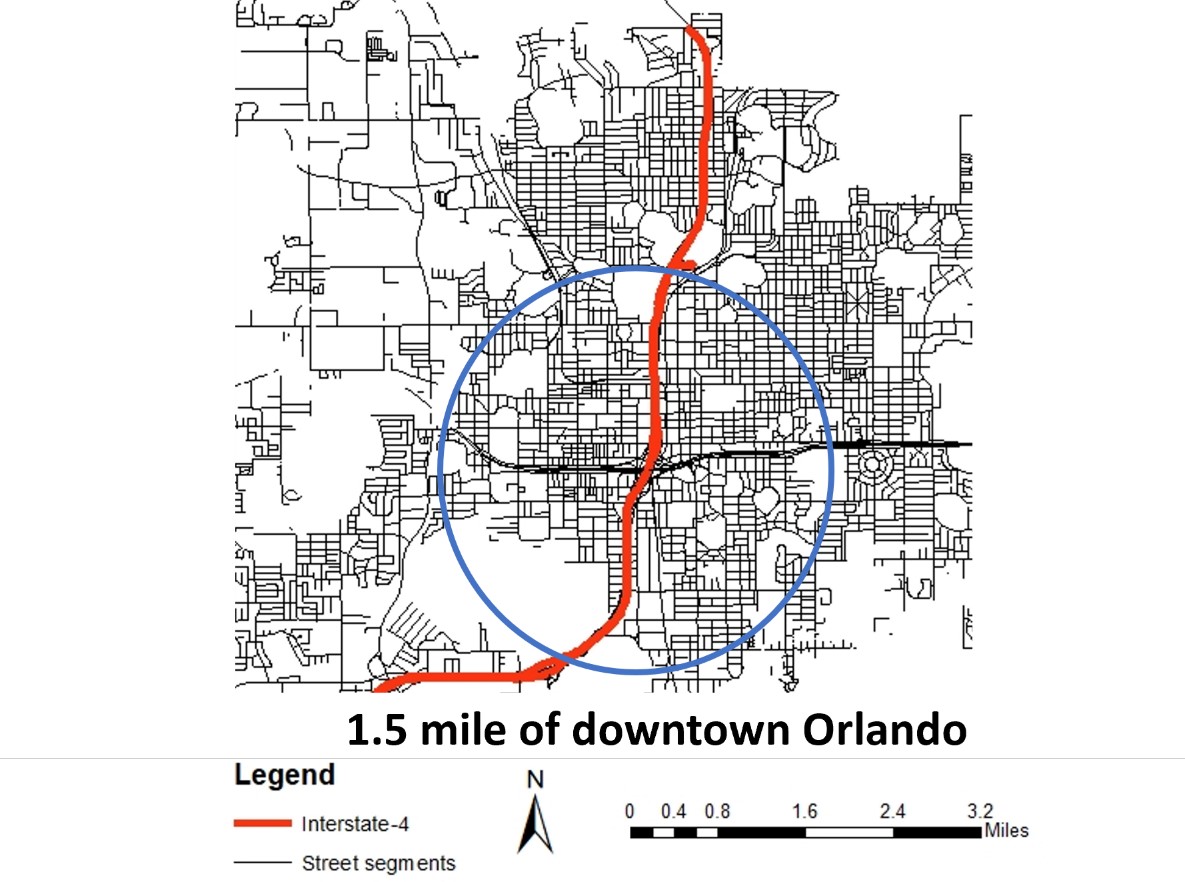
Downtown Orlando is an ideal location to explore changes in street walkability due to its ongoing and planned construction projects aimed at enhancing pedestrian infrastructure. Initiatives like the Orlando Main Streets Program and projects such as the Creative Village and Church Street Plaza renovations are transforming the area into a more walkable environment. Additionally, the city’s investments in public transit improvements, like the SunRail expansion, support this goal. This study focused on street segments within a 1.5-mile radius of downtown, revealing that Interstate 4 has divided downtown Orlando (Figure 1).

This study used computer vision and machine learning with Google Street View (GSV) data to evaluate streetscapes. Semantic segmentation models extracted information from panoramic images taken every 20 meters along streets in downtown Orlando (Kwon and Cho 2020; Wang et al. 2016). Using longitude and latitude coordinates, images from 2018 to 2021 were retrieved via the GSV API, covering 2,932 street segments and 121,502 GSV panorama images to assess visual streetscape environments.
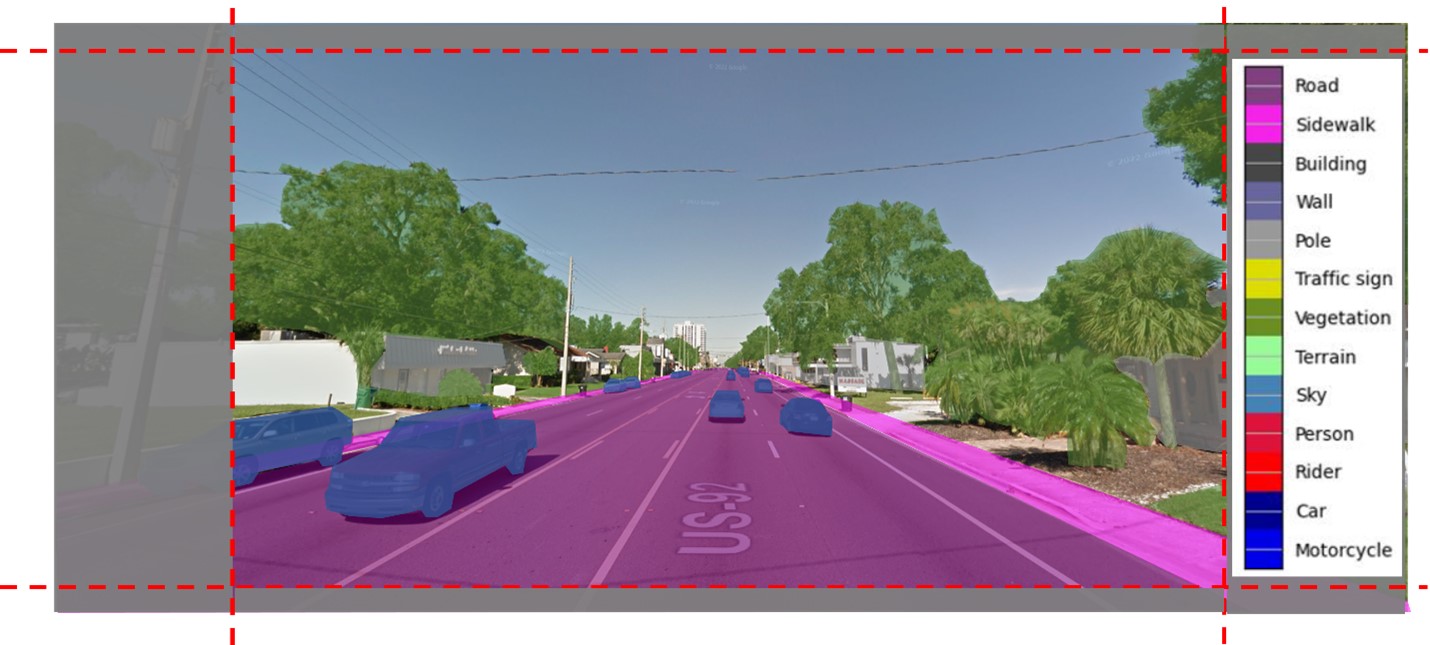
Google Street View (GSV) panorama images provide a 360° view but exhibit edge distortion, leading to inaccurate analysis (Yin and Wang 2016). The central portion, however, experiences minimal distortion (Kim and Woo 2022). To enhance accuracy, this study trimmed the distorted edges following established methodologies (Kim and Woo 2022). The resulting undistorted images were processed using semantic segmentation, a deep learning technique that identifies each pixel in an image (Figure 2). The Deeplab V3+ model, trained on the Cityscapes dataset, achieved a validation accuracy of 0.825 on the Cityscapes test (Xia, Yabuki, and Fukuda 2021).

This research used the Deeplab V3+ model to analyze pixels within GSV panorama images, identifying roadways, sidewalks, street vegetation, and the sky. Transient categories like persons, vehicles, and buildings were excluded (Zhanjun et al. 2022). The study focused on greenery, sidewalk pavement, and outdoor openness due to their direct association with walkability. Street greenery influences residents’ perception of a comfortable and appealing environment for walking (Chiang et al. 2022). The sidewalk pavement serves as a key indicator of pedestrian comfort and safety (Yu and Xu 2017). Outdoor openness is defined as the percentage of sky pixels relative to the total pixels in an image, distinct from drivability openness. This indicator relates to a sense of comfort for pedestrians, helping them perceive and enjoy streetscapes shaped by buildings, trees, and street furniture (Jeon and Woo 2023). Average values for these elements were calculated for each street segment.
3. Findings
Downtown Orlando experienced significant changes in streetscape environments, with increased greenery, reduced outdoor openness, and improved sidewalk pavement coverage
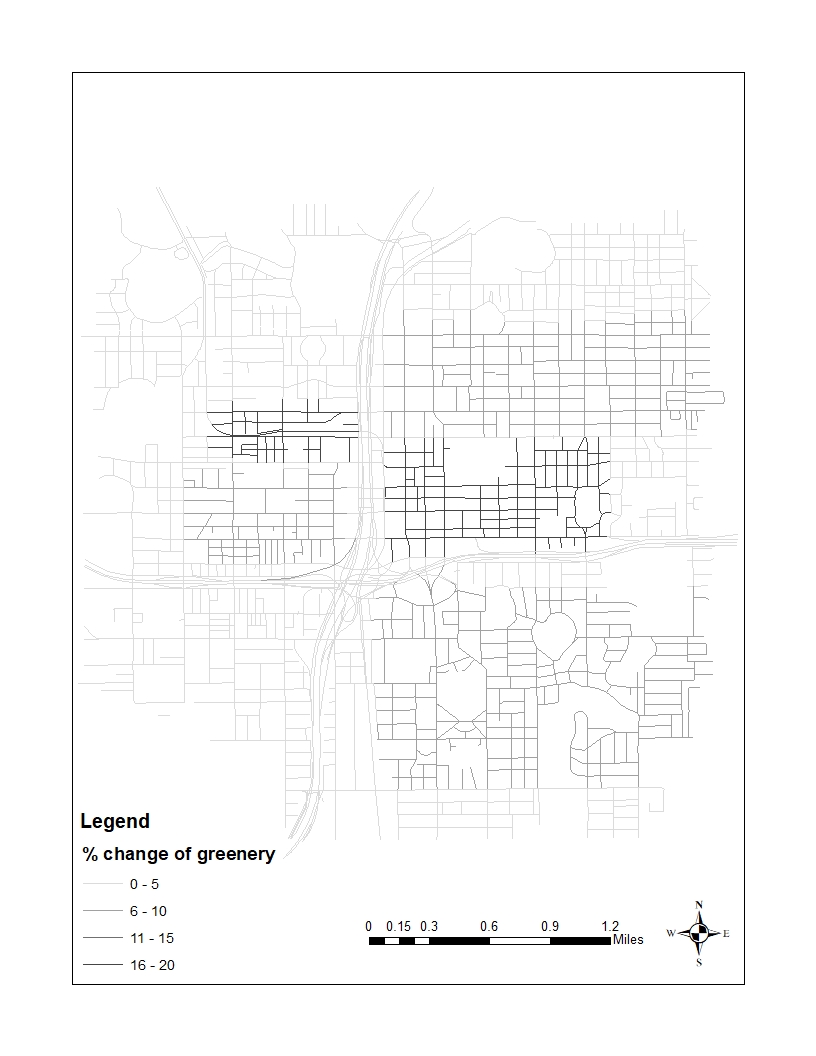
From 2018 to 2021, downtown Orlando experienced significant enhancements in its streetscape environments, focusing on greenery, outdoor openness, and sidewalk pavement quality. The average greenery coverage for the street increased substantially from 7.2% (standard deviation: 5.06) in 2018 to 11.9% (standard deviation: 7.27) in 2021 (Figure 3). The percentage of street segments with the increased percentage of greenery from 2018 to 2021 is 45% among all the street segments within the study area. This increase indicates a concerted effort to introduce more green spaces and trees, contributing to a more aesthetically pleasing and environmentally friendly urban area.

However, outdoor openness saw a reduction during this period. In 2018, the average measure of outdoor openness was 21.3% (standard deviation: 10.34), but by 2021, this figure had decreased to 18.7% (standard deviation: 10.54). The percentage of street segments with the decreased percentage of openness from 2018 to 2021 is 35% among all the street segments within the study area. This reduction is primarily due to the construction of several high-rise buildings, which, while contributing to the city’s economic development, have made public spaces more compact. Notable examples include the new SunTrust Plaza and the Modera Central apartments, which have added to the skyline but reduced the overall openness of public areas.
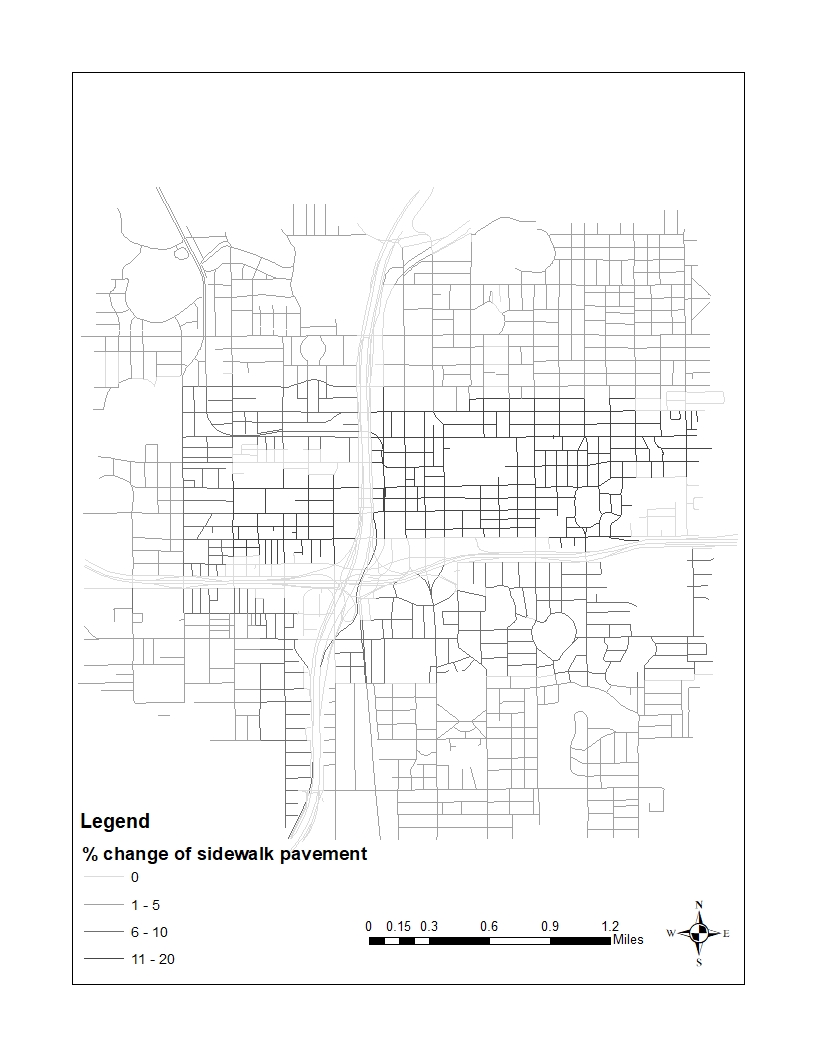
Sidewalk pavement coverage also saw a substantial improvement. The percentage of sidewalk pavements for the street increased from 10.5% (standard deviation: 10.65) in 2018 to 15.8% (standard deviation: 10.52) in 2021 (Figure 4). The percentage of street segments with the increased percentage of pavements from 2018 to 2021 is 65% among all the street segments within the study area. This improvement reflects substantial investments in repairing and upgrading sidewalks, ensuring safer and more comfortable pathways for pedestrians.

Variation exists between west and east downtown Orlando divided by Interstate-4
Variation exists in the streetscape environments of sidewalk pavements, openness, and greenery between the west and east sides of downtown Orlando, divided by Interstate-4. In terms of sidewalk pavements, the east side demonstrates significantly better conditions in 2021, with 57.5% of the street segments having sidewalk pavements compared to only 29.6% on the west side. Regarding street greenery, the east side of downtown Orlando also outperforms the west side. The average greenery coverage on the east side is 15.8% (standard deviation: 1.10), while the west side lags behind with only 7.2% (standard deviation: 0.90) in 2021. Both sides of downtown Orlando maintain a similar level of outdoor openness, each averaging around 19%.
The east side, with its higher population density and more businesses and residents, benefits from better infrastructure, including sidewalks and tree shading, due to the greater demand for walking. This has led to more projects focused on sidewalks and greenery, such as Vision Zero Orlando and The Canopy. In contrast, the west side had remained mostly vacant until recent development sparked by the opening of the university’s downtown campus. As a result, the west side has lower walking demand and comparatively insufficient infrastructure.
A key limitation of this study is the effect of seasonality on greenery measurements, as foliage varies across seasons, causing inconsistency. The irregular timing of Google Street View imagery further adds to this variation. Future research should standardize data collection or account for seasonal changes in vegetation. Additionally, focusing solely on physical infrastructure overlooks other factors like safety and accessibility. Future applications should incorporate broader datasets and account for changes to better capture the evolving nature of urban spaces. Despite of the limitation, this study’s use of Google Street View data and deep learning techniques offers promising applications, allowing for continuous monitoring of walkability indicators like greenery, sidewalk coverage, and outdoor openness. It can help guide investments in underserved areas, as seen in the variations between the east and west sides of downtown Orlando.