
1. Questions
Parental driving is high and has been increasing for several decades across the Western world (Hillman, Adams, and Whitelegg 1990; Bradshaw and Jones 2000; Pooley, Turnbull, and Adams 2005; Hjorthol and Fyhri 2009; Shaw, Watson, Frauendienst, et al. 2013; Kolbenstvedt 2014; Hjorthol and Nordbakke 2015; Nordbakke 2019). In Norway, the share of car use on children’s school trips was 24 percent in 2020, while it was 64 percent on trips to organized sport activities (Opinion 2020). There are several factors that explain the high car share on trips to children’s leisure activities. Long travel distances, gear that needs to be brought back and forth, inadequate public transport (PT) services, the time pressure of organizing of everyday life, and concerns about traffic safety (Mitra 2013; Nordbakke and Lunke 2023), among others.
There is thus a large potential to reduce parental driving, but it requires efficient and acceptable measures. We explore this topic through the following research questions:
-
How do parents evaluate the potential effect of different measures to reduce car use on children’s sports activities?
-
Does parents’ evaluation of effects of measures vary for different sport types?
2. Methods
We use data from a survey (N=285) among parents to children (age 6-12 years) who participate in organized sport activities in Bærum municipality, a suburb to Oslo, the capital of Norway. According to the survey data, the share of car use for trips to sport activities (parents driving their own child) is 60 percent. Bærum is a relatively wealthy municipality by Norwegian standards[1], and this is also visible in our sample: 75 percent of the children live in households with a total income at or above the median income level in Norway. A small majority of our sample were boys (56 percent). More discussion about sociodemographic characteristics and parental driving behaviour can be found in a report based on the same research project (report in Norwegian, with summary in English: Nordbakke and Lunke 2023).
The survey was distributed in the autumn of 2020, where the sport organizations distributed invitations to participate to all members, on behalf of the researchers.
The survey included a set of questions regarding possible measures to reduce parental driving. Respondents were asked “If you were given the offer, could any of the following make you stop driving your child/children to sports activities?”, and could respond one of the following: 1) uses it today, 2) would stop parental driving if we received this offer, 3) would use the offer but still drive occasionally, and 4) would not use the offer. The question was asked for the following five measures:
-
Carpooling: where one parent drive several children to the activity.
-
Gear storage at the activity site: the possibility to store sports gear (skis, ice skates, etc) where the activity takes place.
-
Improved PT: if ordinary PT was better adapted to the child’s needs.
-
Walking or cycling groups: where several children walk or cycle together (with or without an adult) to the activity.
-
Bus to activity: a transport service organized by the club where buses bring children from their home to the activity, and back home afterwards.
We conduct two analyses. First, we graph the distribution of responses for each measure. Second, to answer the second research question, we estimate multinomial logit models for each measure, where the outcomes are the separate responses. The outcomes are conditioned on type of activity, defined by three groups:
-
Soccer and handball: The largest activity types, constitutes around 48 percent of the respondents. These activities usually happen close to children’s residential location.
-
Skiing and ice-skating: Conducted by around 22 percent of the sample. These activities usually happen farther away from children’s homes and require more gear.
-
Other: All other activities, representing 30 percent of the sample. The largest activity types in this group are swimming (20 percent), track and field (12 percent), and tennis (11 percent). These activities usually happen relatively far from children’s home and require less equipment than skiing and ice-skating.
For children who participate in several activities, we asked the parents to answer for the sport type that they participated in most often. Therefore, each parent/child is placed in only one of the activity type groups.
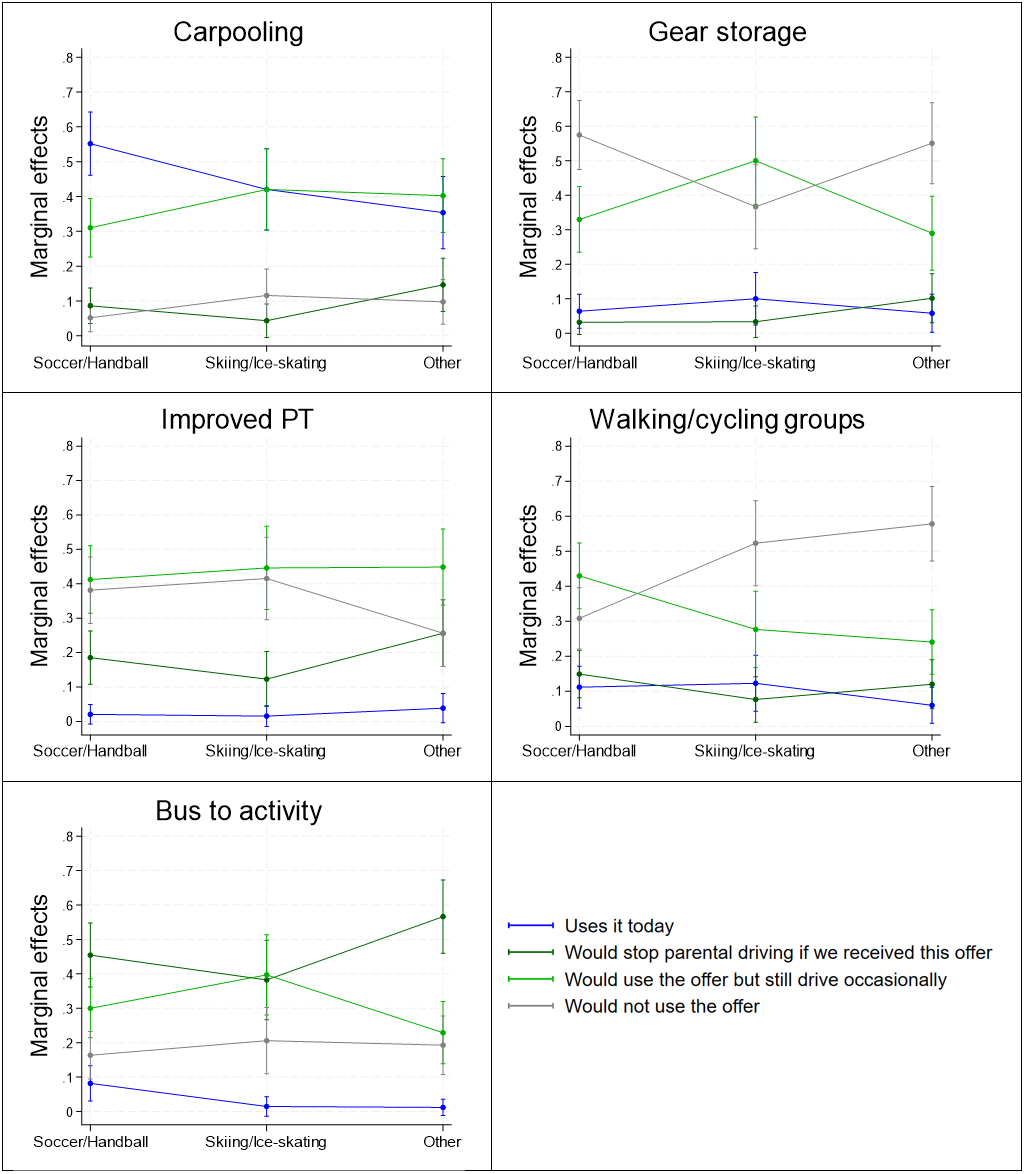
To depict how the responses vary for each activity type, we show graphs of the average marginal effect (AME) of each outcome for each activity type.
3. Findings
Figure 1 shows the distribution of responses for each measure. We see clear disparities in the potential effect. Parents often state that they would use the offers but still drive their children occasionally. Moreover, the largest perceived effect is found in providing buses to activities. Carpooling is also potentially effective but is largely used already.

The AMEs of the multinomial logit models are shown in Figure 2 (full model results are shown in the appendix).

There is a large variation in the perceived effect of measures depending on activity type. For soccer and handball, carpooling is relatively widespread already, and many are positive to walking/cycling groups. Compared to the other activity types, soccer and handball often take place in the children’s local area. The fact that distances are shorter, and that parents know each other from the neighbourhood or school, encourages carpooling more for soccer and handball.
Since skiing and ice-skating requires more gear, plus that these activities happen farther away from the children’s homes, we see that carpooling and walking/cycling groups are less effective measures. Gear storage, on the other hand, receives greater support, although parents state that they would still drive occasionally if they received this offer.
For the other activity types, we find a relatively strong effect of bus to activity and improved PT. This is as expected, as these activities take place more dispersed in the municipality compared to soccer and handball, and since they do not require as much gear as skiing and ice-skating. These are more specialized activities drawing children from the whole municipality and not just the local neighbourhood. Therefore, carpooling and walking/cycling groups are not as relevant as for soccer and handball.
To sum up, we find that the stated uptake – and potential effect on parental driving – varies greatly between different measures. In general, providing bus transport to activities seems to influence the driving behaviour of parents more than other measures. Moreover, the effectiveness of measures varies between different sport activities. For skiing and ice-skating, gear storage can be effective. For soccer and handball, on the other hand, walking/cycling groups could have a stronger effect. One limitation with this study is that we have not explored potential variations in perceived effects of measures among different income groups. This is related to the fact that most of our sample have a high income (see method section). It is however likely that both participation in sport activities, and car use, may be more widespread among more wealthy families. The association between income, activity participation and transport mode use would be useful to investigate in future research on this topic.
Acknowledgements {Fund}
This research was funded by the Norwegian Regional Research Fund Viken, grant number 299208.