1. Questions
As an increasingly diverse array of micromobility devices with and without electric motors are used in off-street cycling facilities and multi-use paths, pathway design practice must move beyond a simple pedestrian/bicycle dichotomy. Given that speed (Boglietti, Barabino, and Maternini 2021; Tan et al. 2019) and comfort (Zhang et al. 2023) are important objective and subjective attributes of micromobility devices for policy and design, in this study we aim to:
-
organize the full array of micromobility devices into speed- and comfort-aligned clusters,
-
quantify the relative impact of each cluster on pedestrian comfort on multi-use paths, and
-
investigate pedestrian comfort in scenarios of evolving electric micromobility.
Pedestrian discomfort in sharing paths with conventional bicycles has led to design guidance to separate pedestrians from bicycles where volumes are sufficiently high (Transportation Association of Canada 2017). To modernize this guidance and account for micromobility, we propose “Path User Comfort Equivalents” PUCE, a design concept similar to the “Passenger Car Equivalents” widely used in traffic engineering to account for the capacity impacts of different types of motor vehicles.
This study does not investigate other factors like path width, capacity, and riding behavior. Future research could refine the PUCE concept by incorporating these environmental and behavioral factors.
2. Methods
We use data from a previous study at 12 off-street path locations in metropolitan Vancouver, Canada (Hassanpour and Bigazzi 2023, 2024a). Cruising speed observations of 25,053 devices over four seasons were categorized into 27 types defined by 10 observable features such as number of wheels and motorization, and then aggregated to 22 devices based on feature similarity and mode share. Ratings of comfort in sharing the path with each of these device types and with pedestrians (on a scale of -10 “very uncomfortable” to 10 “very comfortable”) were collected from 1,054 path users at the same locations (Hassanpour and Bigazzi 2024b). To answer the objectives above:
-
We use k-means clustering to group the 23 modes of travel into 4 speed and comfort-aligned clusters using 4 variables: average speed, average comfort reported by pedestrians, average comfort reported by people riding bicycles (conventional or electric), and average comfort reported by people riding other types of devices (data provided in Supplementary Material).
-
We determine the PUCE for each cluster as the difference in mean pedestrian comfort with devices in that cluster versus with other pedestrians normalized to the difference for the highest-comfort Cluster 1: (Equation 1). Hence, each device in cluster has the equivalent effect on pedestrian comfort as devices in Cluster 1.
-
We simulate average pedestrian comfort levels for scenarios of electric micromobility market penetration (5% to 50%) and micromobility speed changes (±5 and ±10 km/hr) using bootstrapping with replacement, resampling from reported pedestrian comfort levels, adjusted based on a previously established relationship between comfort and speed.
3. Findings
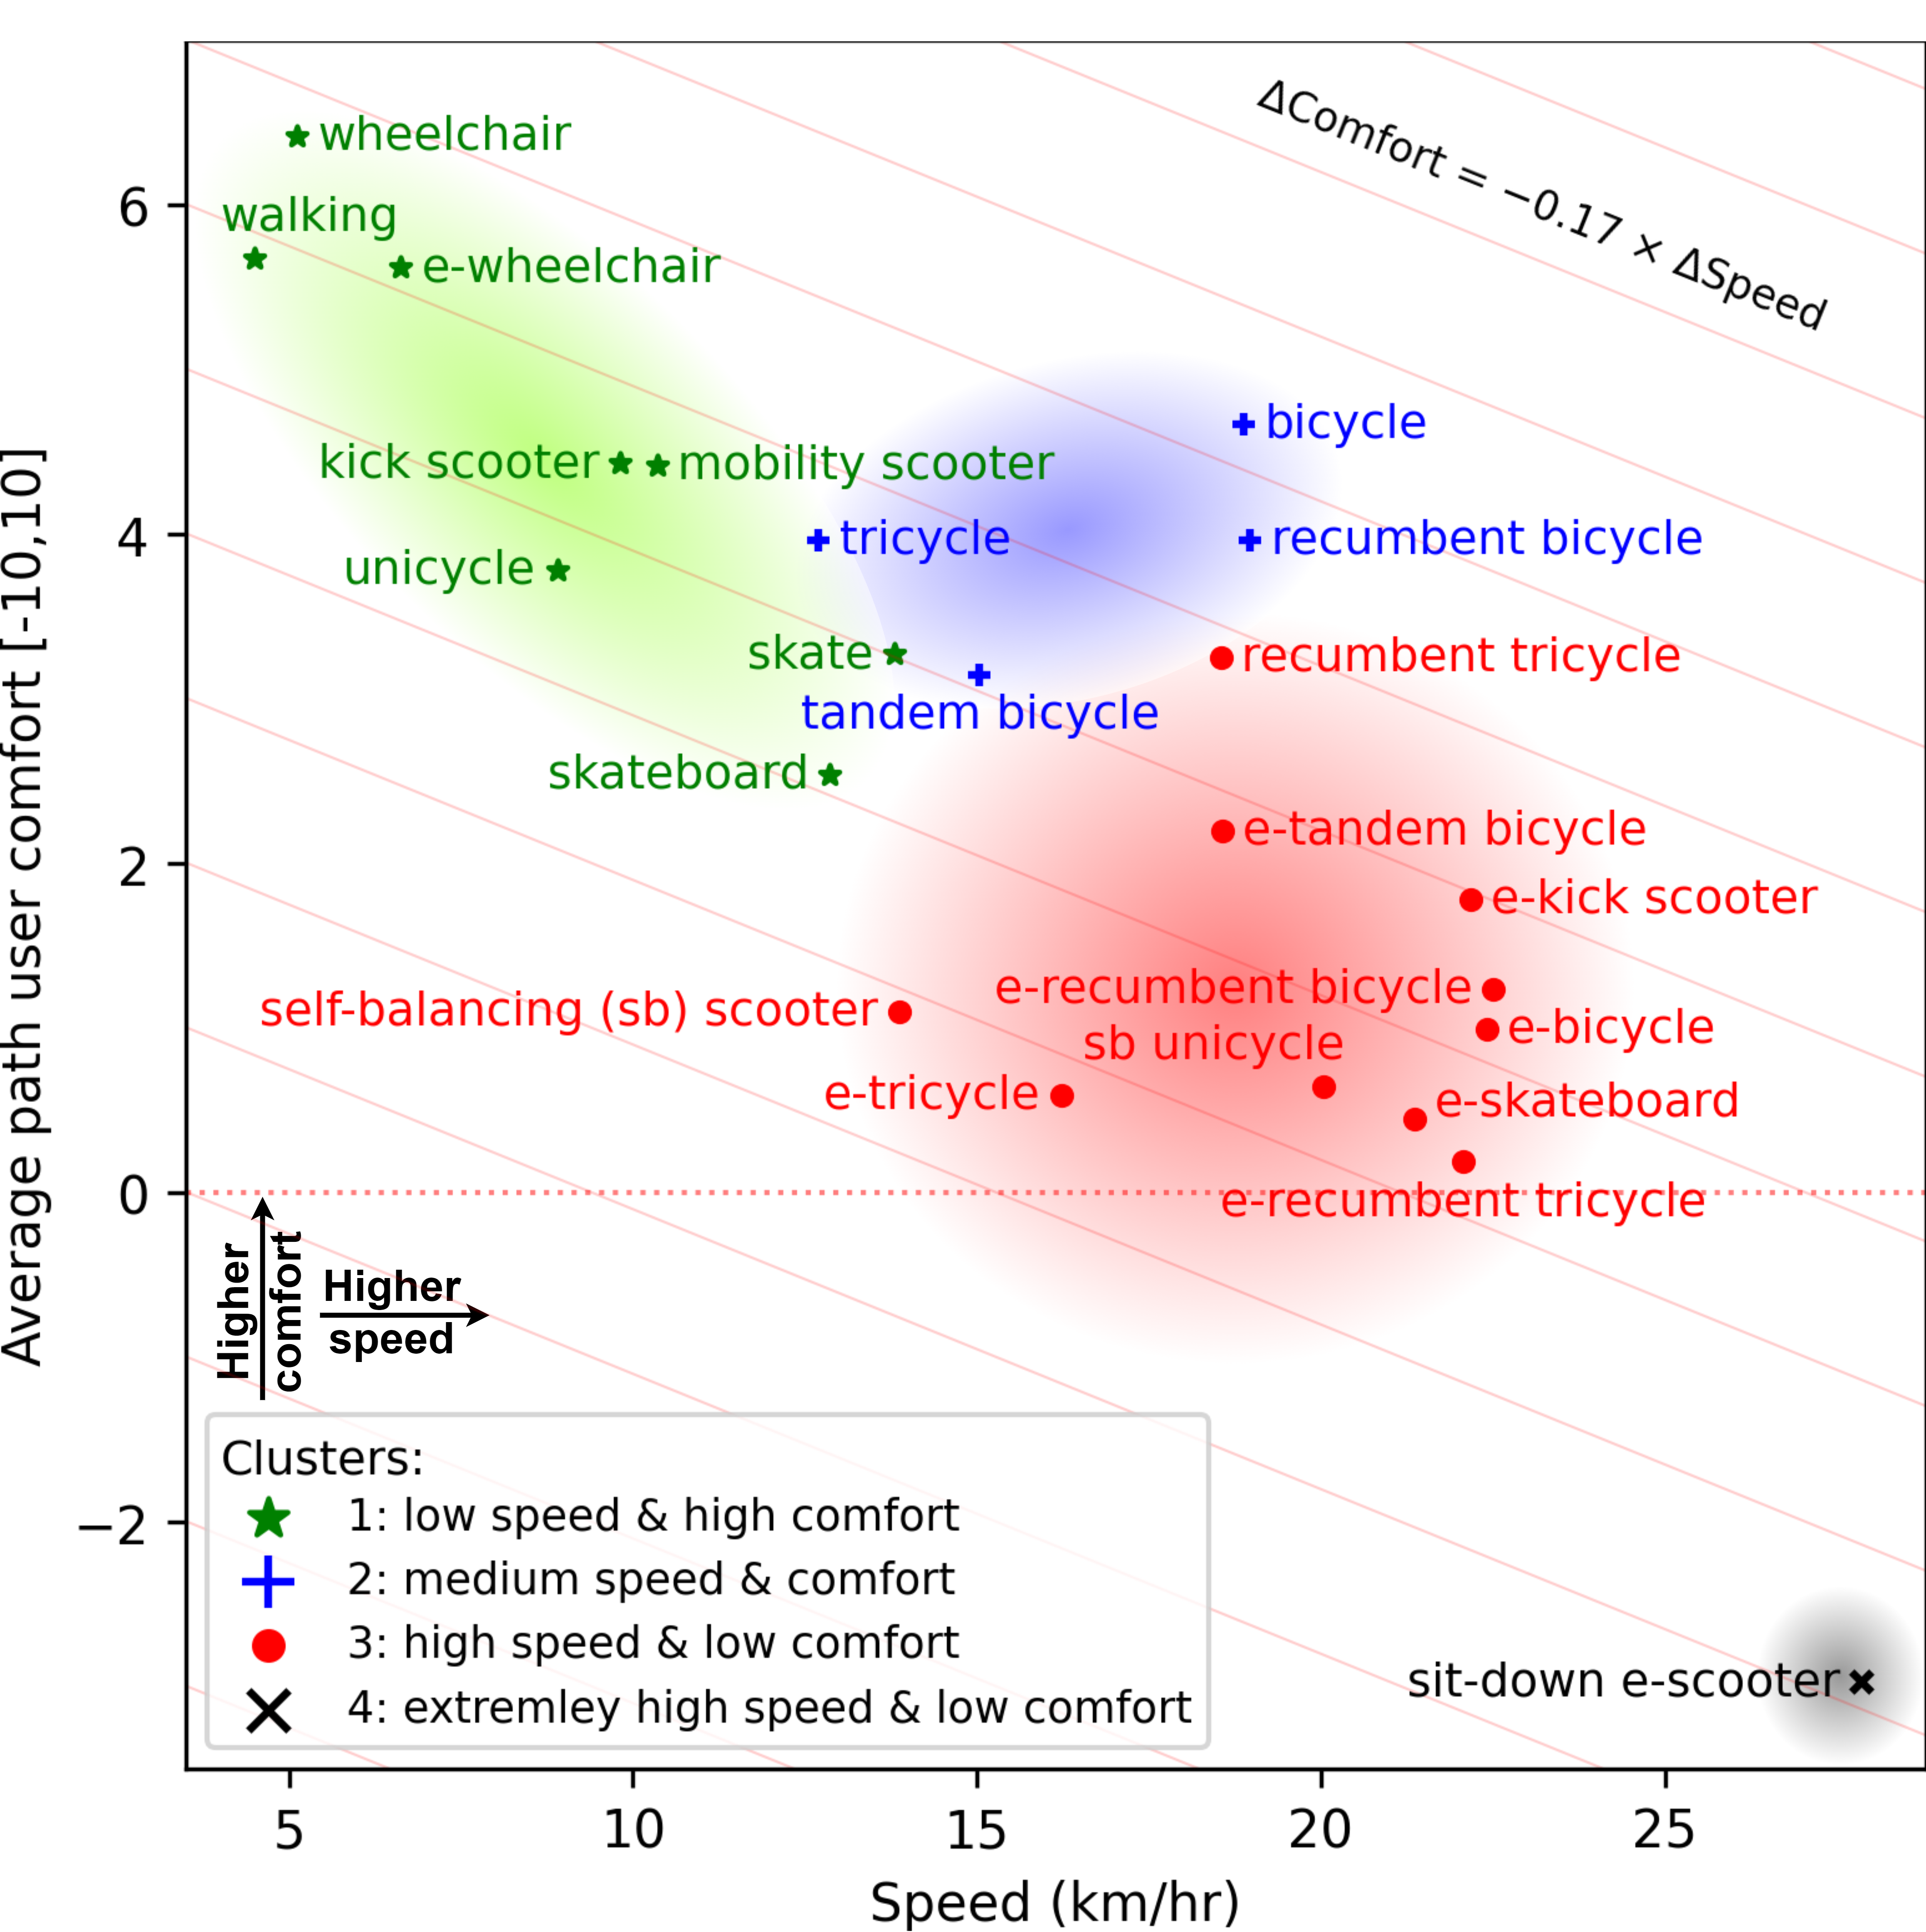
The clusters are presented in Fig. 1, along with iso-comfort lines showing a decrease of 0.17 units in comfort for each 1 km/hr increase in device speed, based on regression modelling on the same data (Hassanpour and Bigazzi 2024b) describing the relationship between comfort and speed. Cluster 1 includes people walking and low-speed devices and mobility aids such as roller/in-line skates, conventional wheelchairs, electric wheelchairs, mobility scooters, conventional kick scooters, skateboards, and unicycles. Cluster 2 includes conventional bicycles, conventional recumbent bicycles, conventional tandem bicycles, and conventional tricycles, which have moderate speeds and comfort. Cluster 3 includes most motorized devices such as electric bicycles, scooters, skateboards, self-balancing electric unicycles, and self-balancing stand-up scooters (Segways and hoverboards), which have higher speeds and lower comfort than conventional bicycles. Lastly, Cluster 4 consists of only sit-down electric scooters (moped-style motorcycles), which are clear outliers in high speed and low comfort for other path users.

Model results using 2 to 5 clusters are presented in the Supplementary Material. The 3-cluster model combines sit-down e-scooters with other electric micromobility devices. The 2-cluster model further merges non-motorized devices into one cluster. The 5-cluster model moves conventional skateboards out of Cluster 1 and divides the motorized devices in Cluster 3.
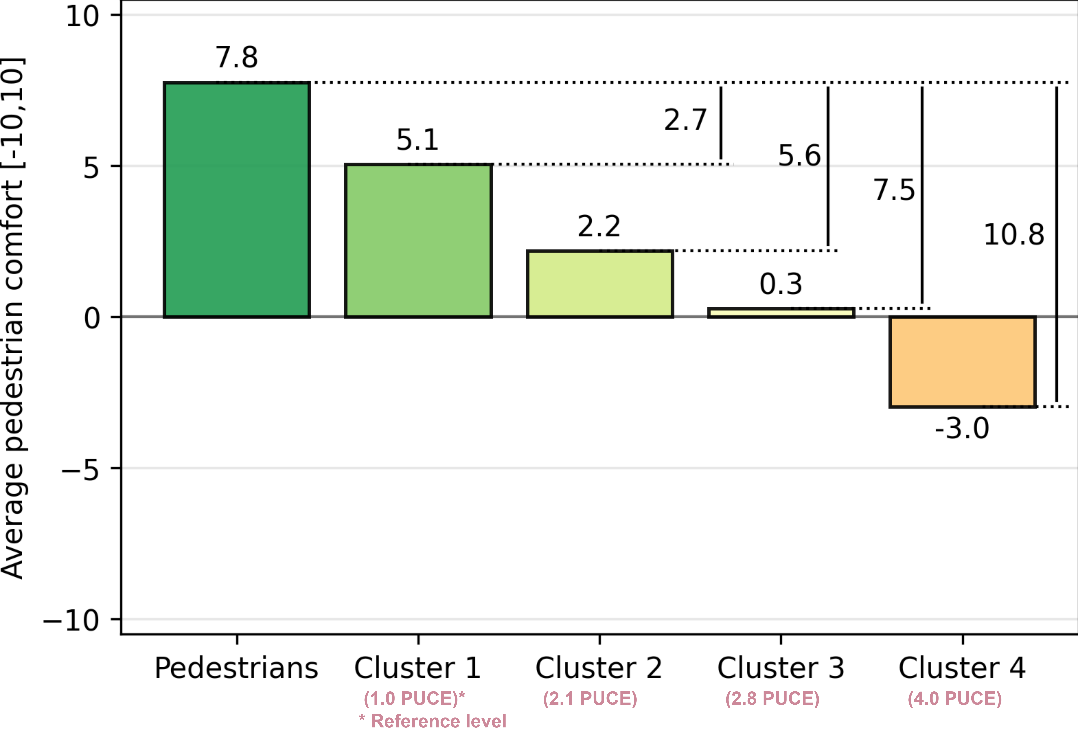
Figure 2 shows the average comfort reported by pedestrians in sharing the path with other pedestrians and devices in each cluster. Using these results and Equation 1, the PUCE of devices in clusters 1, 2, 3, and 4 are 1.0, 2.1, 2.8, and 4.0, respectively. Hence, the impact on pedestrian comfort of each additional Cluster 2 device (e.g., conventional bicycle) is equivalent to 2.1 Cluster 1 devices (e.g., wheelchair) and each additional Cluster 3 device (e.g., e-scooter or e-bike) is equivalent to 2.8 Cluster 1 devices. Also, each motorized micromobility device in Cluster 3 has the comfort-equivalent effect of 1.3 conventional bicycles (Cluster 2).

These PUCE can be used to adjust multi-use path volumes to reflect different impacts on comfort, and so applied to design thresholds for pedestrian segregation or other comfort-based design criteria. In the examples illustrated in Table 1, a path with 20 Cluster 1 users (pedestrians, wheelchair users, skaters, etc.) and 80 Cluster 2 users (conventional bicycles) per hour meets the threshold for pedestrian separation with 100 path users based on existing guidance (Transportation Association of Canada 2017). This path has 188 PUCE per hour (Example 1). With 50% electric bicycle penetration (Example 2), the PUCE increases to 216 due to higher discomfort caused by electric bicycles. The path reaches the same discomfort threshold as Example 1 at just 88 users (68 bicycles) per hour, which is 15% fewer bicycles.
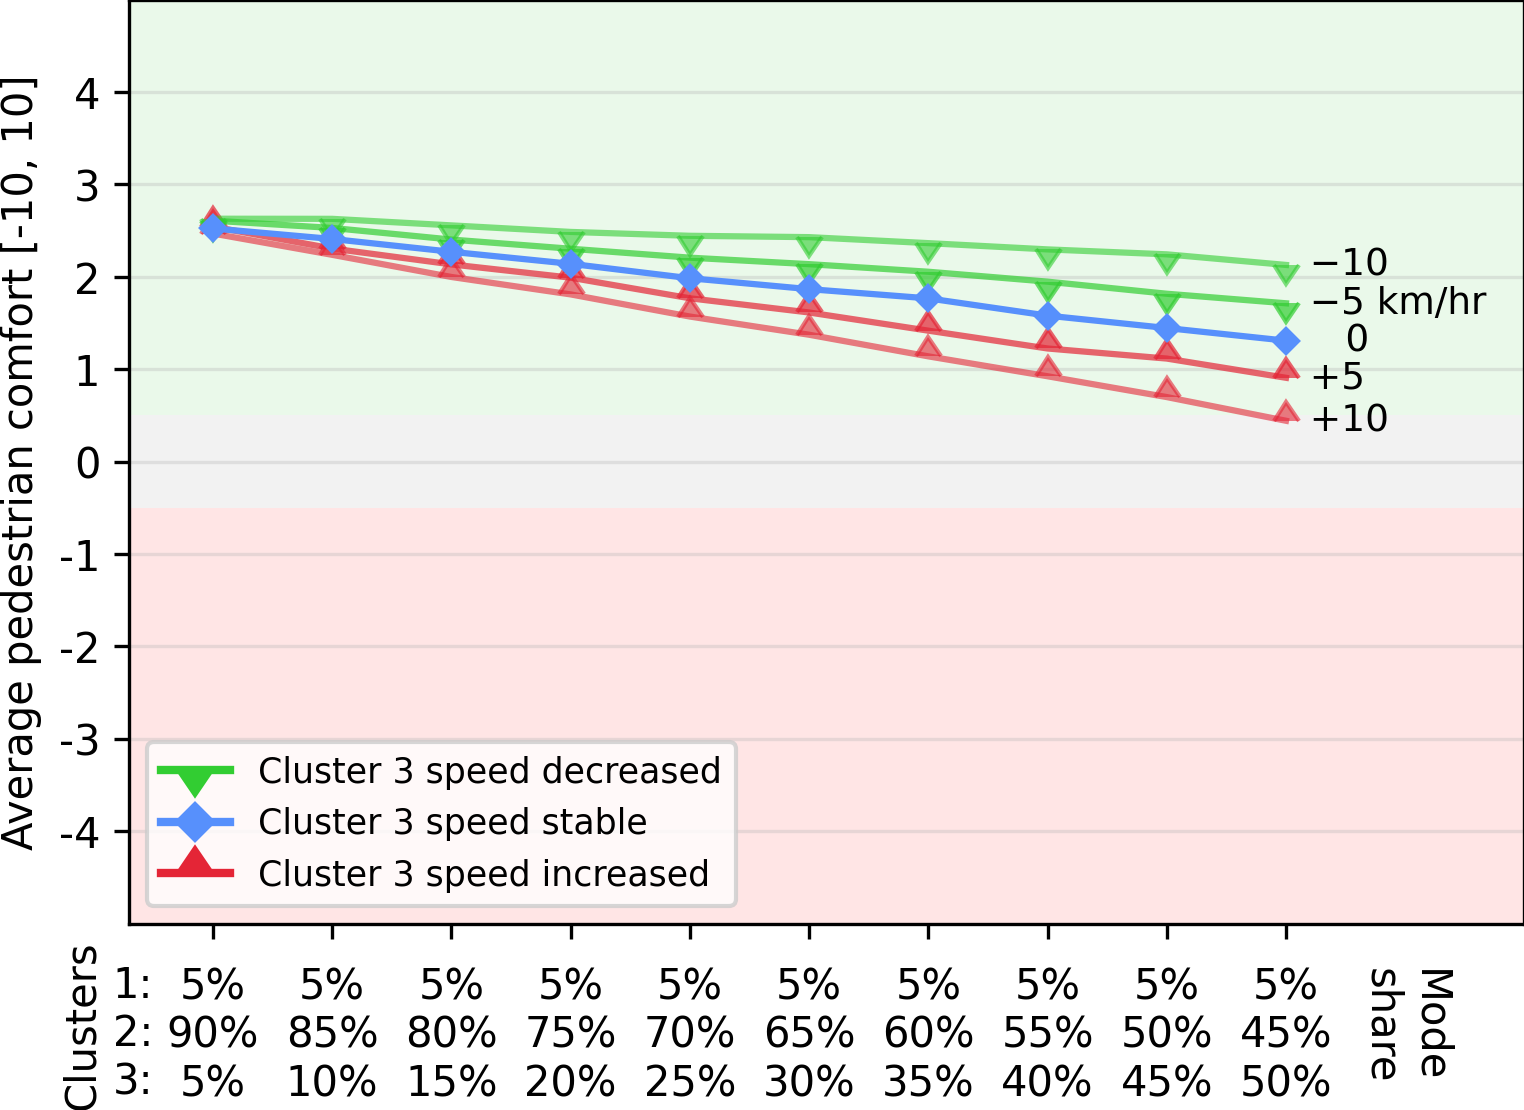
The scenario results, presented in Figure 3, suggest that even at 50% market penetration of today’s electric devices, a majority of pedestrians would still be comfortable on multi-use paths, although feeling less comfortable overall. However, if the market share increase is accompanied by an average speed increase of more than 10 km/hr in Cluster 3 devices, a majority of pedestrians would be uncomfortable. This finding suggests that speed regulation and control for Cluster 3 may help maintain pedestrian comfort as new micromobility devices enter the market.
