1. Questions
On April 8, 2024, a spectacular celestial event – a total solar eclipse – made its way across North America. A total solar eclipse occurs when the Moon aligns perfectly between Earth and the Sun, creating temporary darkness, with an amazing illuminating effect around the outside of the moon – known as a corona. The regions that experience this effect is called the path of totality, which in this particular eclipse passed through Mexico, the United States, and Canada, notably moving through eastern Canada from approximately 2 p.m. to 5 p.m. EDT. Several provinces in Canada (Ontario, Quebec, New Brunswick, Nova Scotia, Prince Edward Island, and Newfoundland and Labrador) were within the path of totality, attracting a significant influx of visitors seeking to observe this once-in-a-lifetime event.
Understanding the number of visitors and their travel behaviors in response to such events can be crucial for transportation planning and emergency response (Fan and Stewart 2021; Li and Kalinzi 2024). Previous studies have demonstrated the utility of large-scale mobile device datasets in identifying dynamic human mobility patterns and fine-scale population dynamics associated with short-term events such as natural disasters (Liao, Zehra, and Wong 2024; Yabe et al. 2019) , social movements (Van Dijcke and Wright 2020), and large-scale events (Altin et al. 2022).
In this study, we employ de-identified network mobility data from a large Canadian telecommunications firm to estimate the number of visitors to the path of totality and study human mobility patterns during the period of the total solar eclipse across Canada. Specifically, we address five main research questions: 1) How many people travelled to see the total solar eclipse in Canada, 2) Where did visitors go to observe the total solar eclipse, 3) Where did visitors travel from to observe the total solar eclipse? 4) Was visitation to the total solar eclipse abnormally high compared to a baseline period? and 5) Does distance to the path of totality influence the number of travellers?
2. Methods
We employed de-identified mobile-phone network mobility data from TELUS Communications Inc. through their TELUS Insights platform. TELUS has a market share of about 35% and serves approximately 9.8 million Canadian subscribers. The TELUS Insights data extrapolates population-level visitor and travel counts based on highly detailed market shares by census subdivision. The de-identified data comprise of cell tower connections, which capture fine-scale spatial movement in urban areas where the network of towers is dense, and coarser-scale spatial movement in rural areas where towers are more sparse. For each device connected to the TELUS network a first- and second-cluster of towers were identified (see Long and Ren 2022 for further details), which are used to represent the home and work locations (or first and second places) of each device.
Our analysis focuses on the number of mobile devices, whose home cluster location was outside of the path of totality, that visited the path of totality on April 8, 2024, between 2:00 p.m. and 5:00 p.m. EDT. We included only those devices with a minimum duration of 30 minutes in the path of totality, and we excluded all devices whose workplace (second place) was located within the path of totality. To report human mobility patterns, we use aggregate dissemination areas (ADAs) which are Canadian census units combining multiple census dissemination areas and comprise a population of approximately 5000-10000 individuals. These geographical units have been used with the de-identified TELUS network mobility data to study human-mobility patterns during the COVID-19 pandemic in Canada (Long et al. 2023; Long and Ren 2022).
We calculated the total number of visitors from each Canadian province that visited the path of totality. Next, we calculated the number of visitors to each ADA within the path of totality, where we clipped ADAs to match exactly the path of totality. From the visitor counts, we identified the top destinations for people viewing the total solar eclipse. For each estimate of visitor counts, we computed the adjusted visitor counts as follows:
VCa=VCe−VCb
Where is the adjusted visitor counts, is the total number of visitors during the total solar eclipse, and is defined as the average daily number of visitors between April 15 to April 19 (one week following the eclipse, between the times of 14:00 and 17:00 EST, hereafter referred to as the baseline). The adjusted visitor counts are positive when visitor counts are above the baseline, and negative if the visitor counts were lower than the baseline.
We calculated the number of travellers to the path of totality for all ADAs within a 300 km distance of the path of totality. We standardized the number of travellers by the origin ADA population (travellers per 1,000 population) and compared the standardized traveller count to the distance to the total solar eclipse. We again adjusted standardized traveller counts by subtracting from the baseline period as follows:
TCa=TCe−TCb
Where is the adjusted standardized traveller counts (per 1,000 population), is the total standardized traveller counts during the total solar eclipse, and is the standardized daily traveller counts during the baseline period. The adjusted traveller counts are positive when there were more travellers to areas within the path of totality than in the baseline period, and negative when there were fewer travellers to the path of totality than in the baseline period. We then calculated the distance-decay effect of the adjusted traveller counts using a negative Gaussian exponential model.
3. Findings
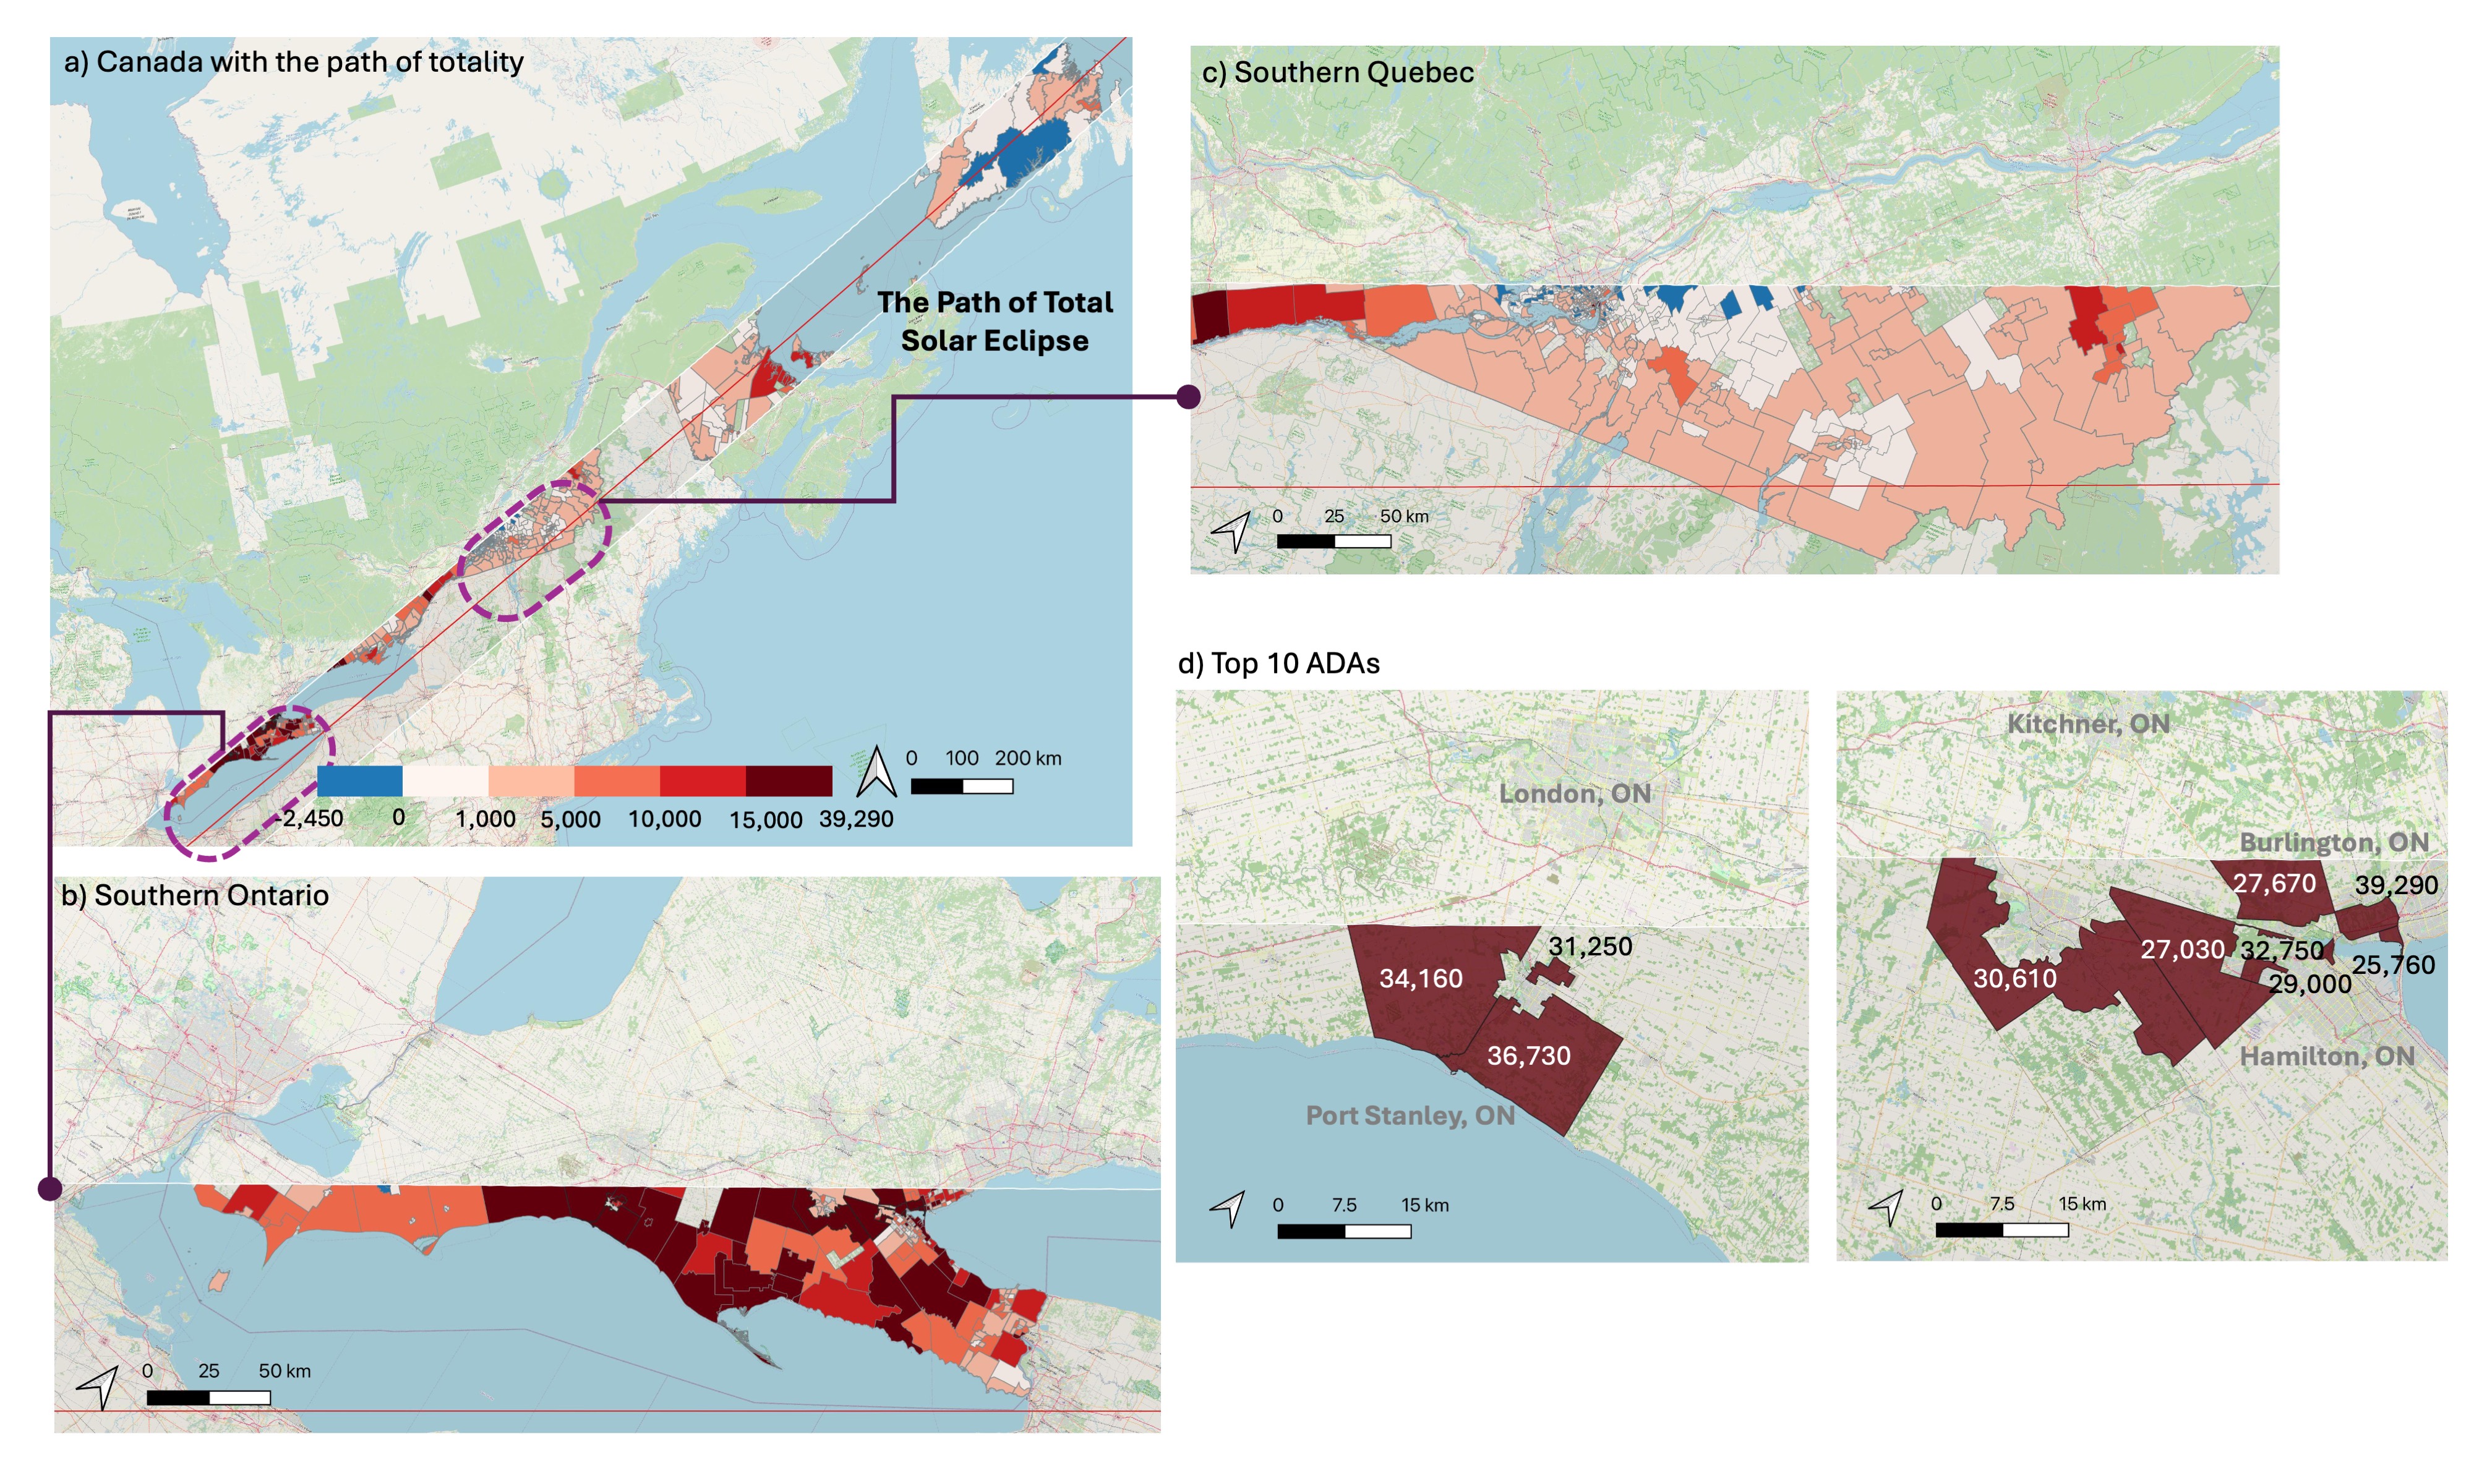
During the three-hour period of the total solar eclipse, using adjusted visitor counts we estimated that 589,290 Canadians travelled from outside of the area covered by the path of totality to inside of it (Table 1). In particular, 42,220 people were estimated to have travelled from another province to view the total solar eclipse. In Ontario alone, we estimated 428,500 people travelled (either from another province, or from elsewhere in Ontario) to view the total solar eclipse.
The majority of visitors selected total eclipse destinations in Ontario, particularly near Lake Erie - including the Niagara Falls, Port Stanley and lake front areas of Burlington and Hamilton- where the top 10 ADAs for adjusted visitor counts are located (Figure 1b and d), with counts exceeding 25,000 visitors. In Quebec, the Montreal area, particularly within the old city center, some areas showed a small decrease in adjusted visitor counts (Figure 1c), indicating fewer visitors during the event compared to the baseline.
_--_c)_spatial_distribution_of_adjusted_visitor_counts_for_aggregate_dissemination_area_.jpg)
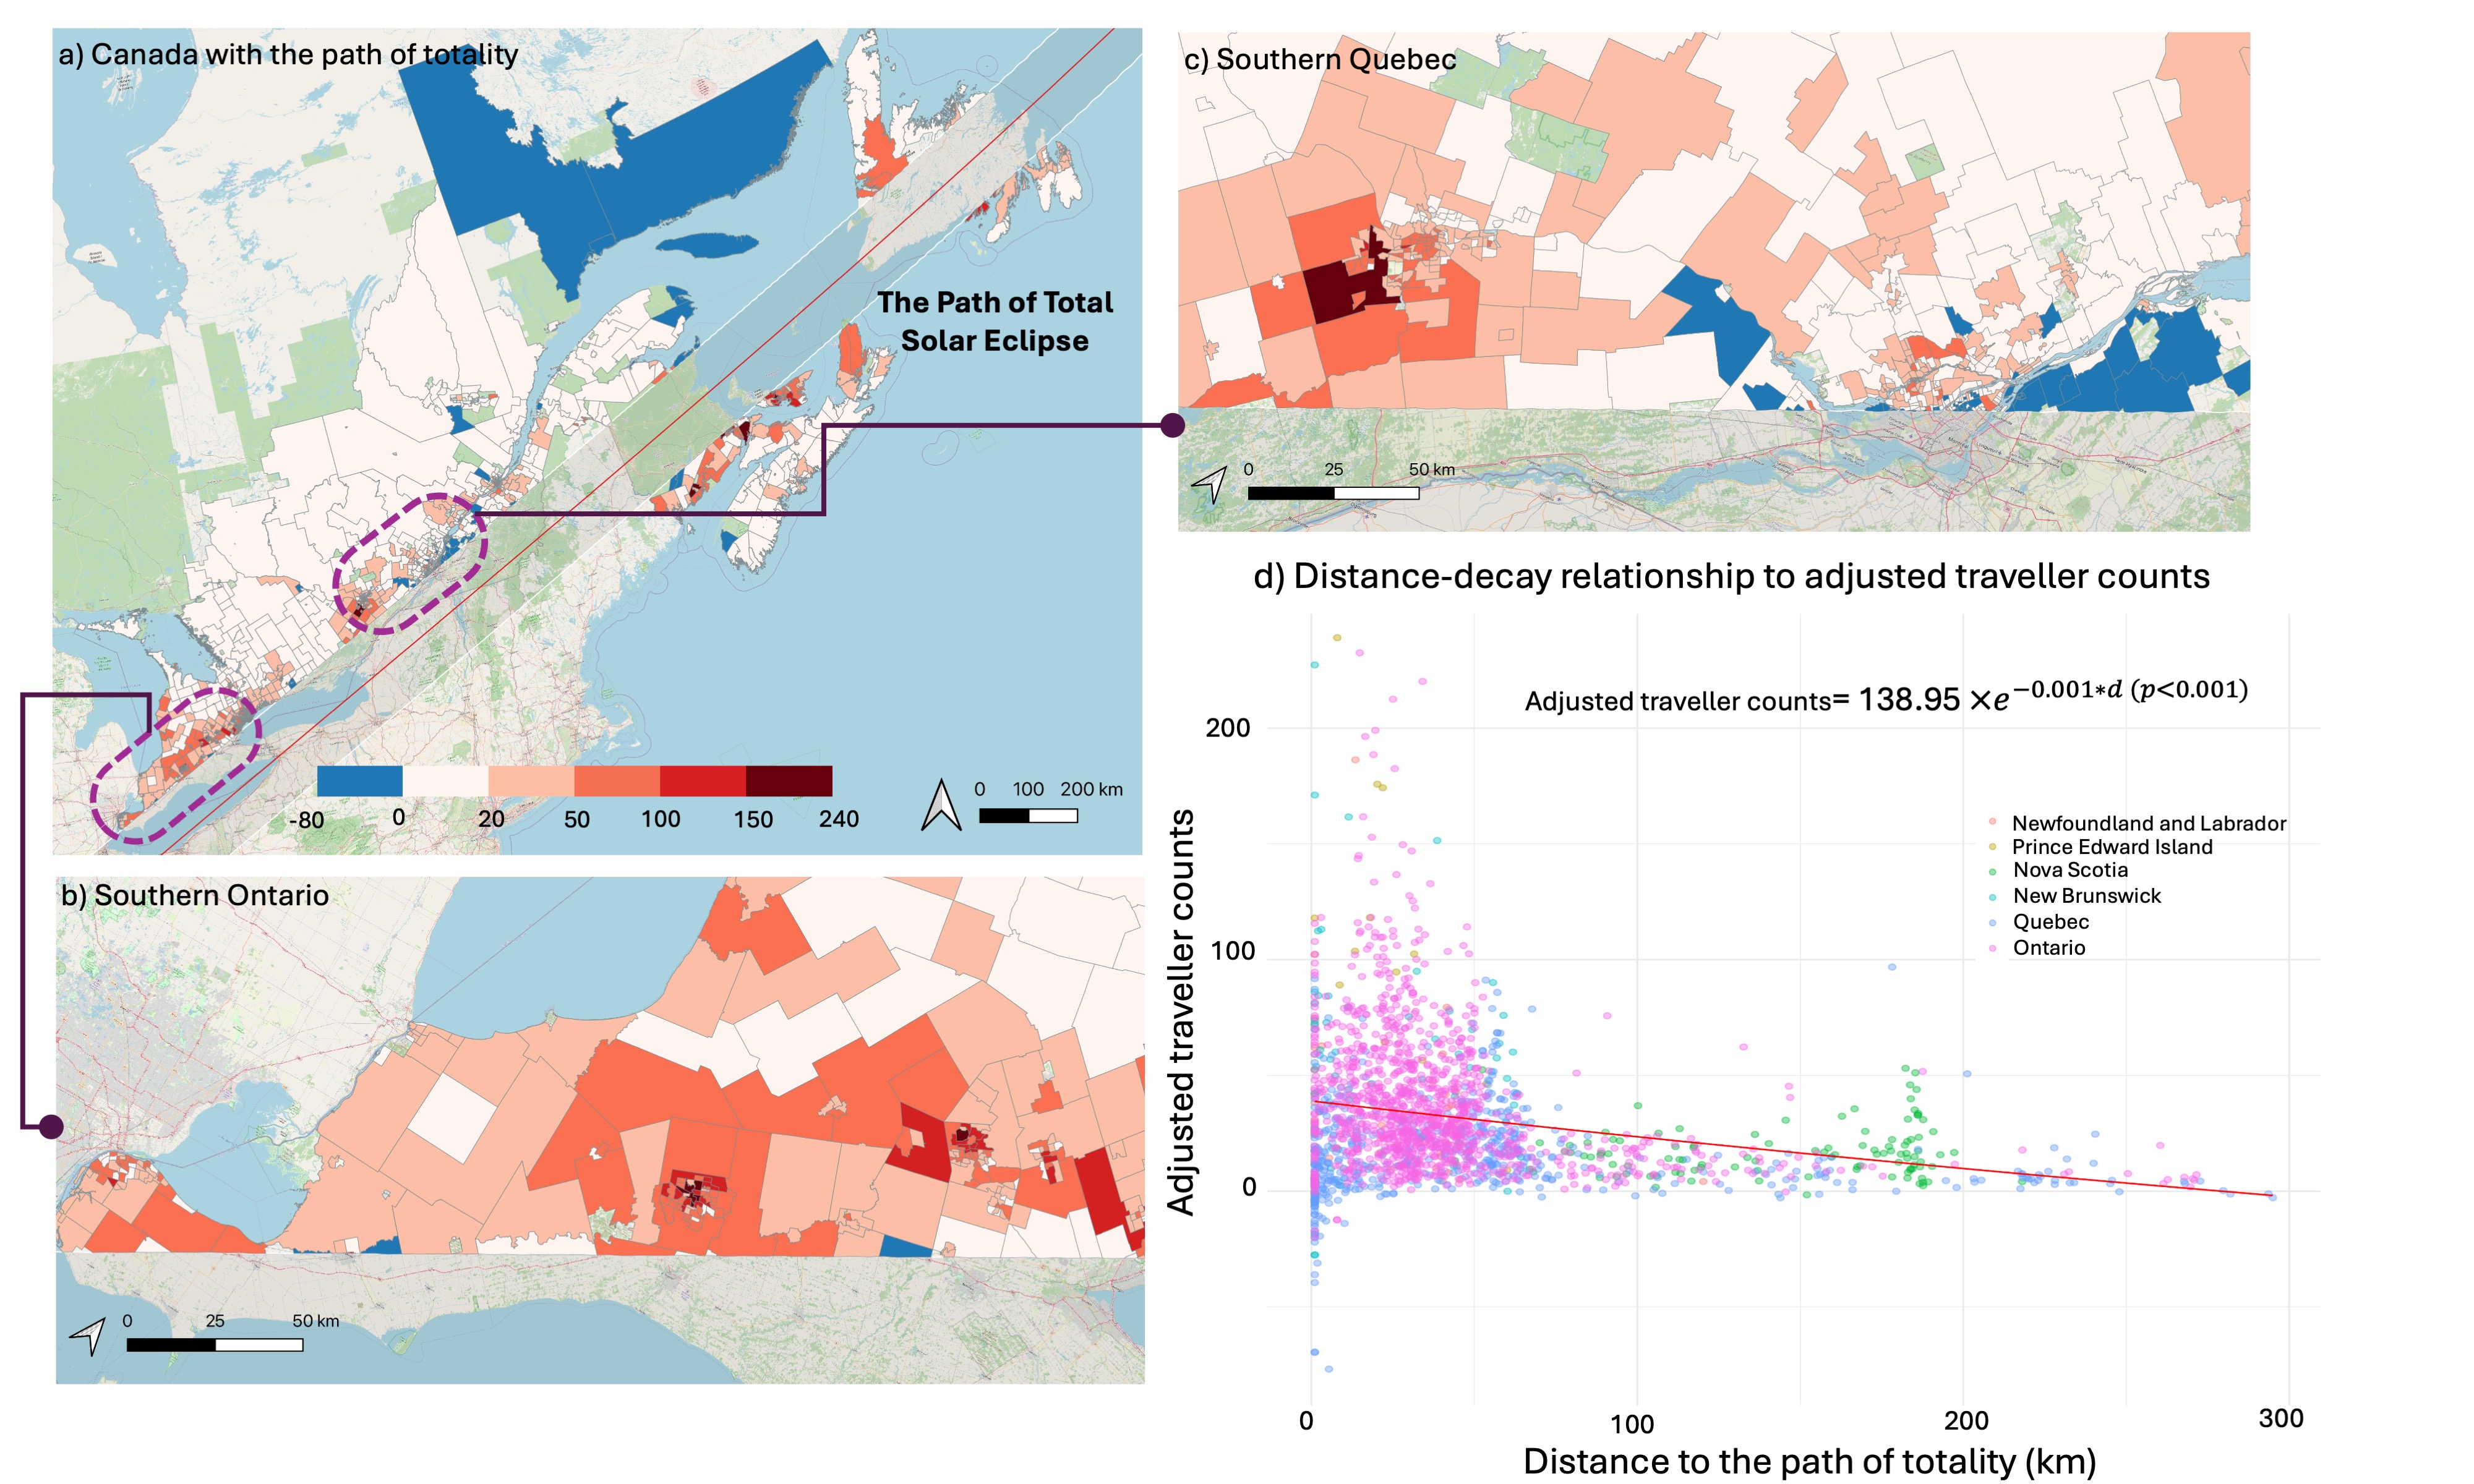
The adjusted traveller counts to the total solar eclipse were concentrated near the path of totality in the cities of London, Kitchener-Waterloo, and Toronto in Ontario, where we found several ADA census regions with over 150 (per 1000 population) travellers to the path of totality (Figure 2a and b). In contrast, we found that high adjusted traveller counts did not occur in the ADAs located further away from the path of totality or in Quebec, particularly near downtown Montreal (Figure 2a and c). We observed a significant distance-decay effect for adjusted traveller counts (Figure 2d), indicating that distance does at least partially explain the change in mobility patterns during the eclipse.
_--_c)_spatial_distribution_of_adjusted_traveller_counts_(per_1000_population)_showing_f.jpg)
Our results summarise the human mobility patterns of Canadians during the 2024 total solar eclipse. We found that a large number of Canadians travelled near and far to view this once in a lifetime event. The top destinations of these travellers reveal the hotspots for viewing the total solar eclipse. We found that there was evidence for a distance decay effect between adjusted traveller counts and distance to the path of totality. Our work provides further compelling evidence of how network mobility data can be used to study human mobility patterns associated with large-scale events.
Acknowledgements
We are grateful to TELUS Communications Inc., through their Data for Good program for providing us access to the de-identified TELUS Network Mobility Data (https://www.telus.com/en/about/privacy/data-for-good).