

RESEARCH QUESTION AND HYPOTHESIS
Travel time remains one of the most important factors for mode choice (Clarry, Faghih-Imani, and Miller 2019; Mokhtarian and Chen 2004). In dense urban areas cycling is often competitive with driving regarding travel time, and even faster in some cases, especially during rush hour or for short trips (Faghih-Imani et al. 2017; Jensen et al. 2010). Along with the many health or environmental benefits (Vandenbulcke et al. 2011), this may explain the increase in cycling in cities (McLeod and Murphy 2014). Comparing travel times for different modes is only possible for pre-defined origin-destination pairs, which may not be easily correlated with the possible explanatory factors, especially spatial attributes of roads and cycling facilities (Clarry, Faghih-Imani, and Miller 2019). On the other hand, speeds along a trip can be associated with nearby spatial characteristics and speed comparisons can therefore be done for spatial zones. This paper provides a descriptive comparison of the speed of trips by mode of transportation, in this case by cars and bicycles, and by spatial zone to get a clear picture of their relative spatial competitiveness.
METHODS AND DATA
The Data
In this research, the crowdsourced datasets “MTL Trajet” collected by the City of Montreal in Canada and made available on its open data portal were used (Ville de Montréal 2019). These datasets contain trips made in the Greater Montreal Area recorded in the month of October of 2016 and 2017 via a mobile application. Each trip is composed of a series of georeferenced points with timestamp and instantaneous speed (see Table 1 for a sample). Information on the mode of transportation is also provided for some trips. This study focuses only on the trips made exclusively by bicycles or cars.
Data processing
To ensure the quality of the data used in the study, two filters were applied. The first checks that each instantaneous speed is smaller than 17 m/s (61.2 km/h) for bicycles and 45 m/s (148 km/h) for cars. The second filter verifies the participant’s ability to travel the distance between two consecutive points: the Euclidean distance between two points must be smaller than the maximum distance the participant could have traveled during the time interval. This maximum distance is defined by the distance the participant would have traveled with his initial speed at instant an acceleration of 1 m/s2 and a maximum speed of 17 m/s for bicycles or an acceleration of 5 m/s2 and a maximum speed of 45 m/s for cars during the interval between instants n and n+1 as described in formula (1). If the condition is not satisfied, the position n+1 is removed and the same condition is applied to instants n and n+2, and so one. After these two filters, the resulting dataset contains 77 710 trips (17 550 by bicycle and 60 160 by car).
\[d_{\max} = \left\{ \begin{matrix} \frac{1}{\strut 2}*a_{\max}*t^{2} + v_{0}*t,\ t*a_{\max} + v_{0} \leq v_{\max} \\ \frac{1}{\strut 2}*a_{\max}*{t_{1}}^{2} + v_{0}*t_{1} + v_{\max}*(t - t_{1}),\ t*a + v_{0} < v_{\max} \\ \end{matrix} \right.\ \]
where
- t is the duration of the time interval between two points
- is the necessary duration to reach maximum speed
The units of analysis of the study are Transport Analysis Zones (TAZs) provided by the ministry of transportation (see Figure 1) (mean size of 4.5 km2). The mean speed of a trip in a specific TAZ is defined as the average of the instantaneous speeds at each position in the TAZ weighted by the duration between each successive position. If the duration between two positions in the same TAZ is greater than 90 s, the trip was divided in separate trips to separate trip segments of the same participant passing again through the same TAZ. The mean speed of a mode in a TAZ is similarly defined as the average of each trip average speed in the TAZ weighted by the duration of each trip in the TAZ. For statistical reasons, only TAZs with at least 30 records for both cars and bicycles were kept. Overall 546 TAZs met those requirements.
FINDINGS
Figure 1 shows the average speed of cars and bicycles in each TAZ. For both bikes and cars, the average speed is lower in the downtown area than in the more peripheral areas where data is available. Causes of this may however differ depending on the mode. For cars, lower travel speeds are a consequence of the demand and resulting congestion, but also possibly of the road design (number of lanes, density of intersections, signal timing). These factors along with the cycling infrastructure can also affect the speed of bicycles. Bicycle speeds may also be higher in peripheral areas because the type of riders also differs: for example, riders traveling longer distances tend to be fitter and go faster (Jensen et al. 2010). This spread in speed is more important for cars than for bikes: the mean coefficient of variation of the average speed of each mode in a TAZ is 0.28 and 0.17 for cars for bicycles respectively. The average speeds over the 546 TAZs are 8.8 m/s (31.7 km/h) and 4.6 m/s (16.6 km/h) for cars and bicycles respectively.
_and_cars_(right)_in_each_taz.png)
The Figure 2 shows the relative differences in mean speed between bicycles and cars, relative to bicycles, within each TAZ. Only five TAZs show no statistical difference between the mean oncespeeds of bicycles and cars at the 95 % confidence level (labeled “Non-significant difference” on Figure 2). The relative difference is 50 % or less for 148 TAZs, while it is 91.3 % overall. The relative difference is lower in the downtown area. In this area, the relative difference is 50 % or less in 24 of the 51 TAZs. The TAZs with a relative difference higher than 200 % contain highways. Table 2 shows that the relative speed difference in each TAZ increases with the distance to the downtown area.

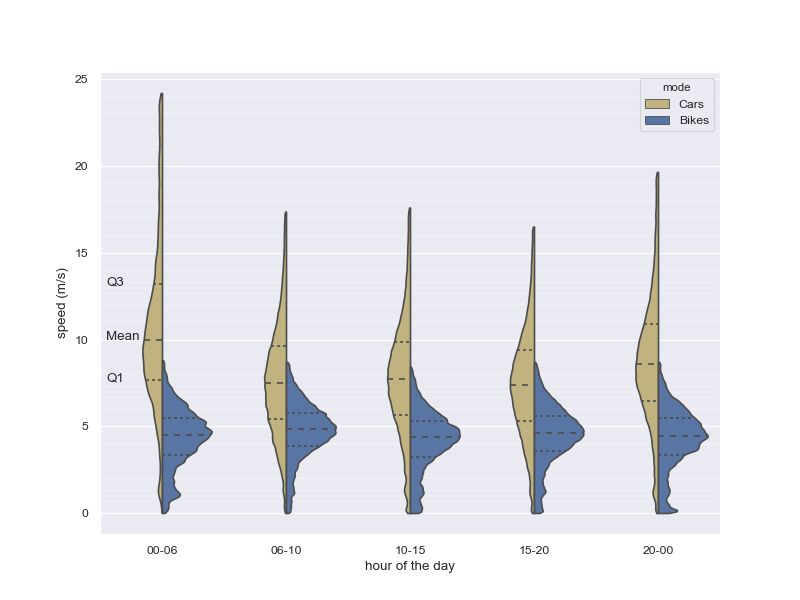
Figure 3 and Table 3 show the repartition of trips and speed statistics depending on the trip start time. Bicycle speeds remain stable over the day and show less variability than car speeds. The mean car speeds greatly decrease during rush hours. Figure 3 also shows that the distributions of speeds for each mode overlap: during morning and evening rush hours, the third quartile of the bike distribution is higher than the first quartile of the cars.

As a final note, this study focused on speed and not one the overall travel time, which include also the time to find a parking and walk to one’s final destination: higher car mean speeds do not necessarily translate into faster trips compared to bicycles.