1. Questions
At the onset of the COVID-19 pandemic, experts in active travel sought to comprehend its effects on cycling ridership (Buehler and Pucher 2021; Rérat, Haldimann, and Widmer 2022). Despite the lack of unified consensus surrounding the overall impact of the pandemic on cycling, most studies report a decline in work-related cycling trips and an increase in leisure cycling as individuals sought exercise and fresh air (Hong, McArthur, and Raturi 2020).
To conduct these studies, researchers frequently relied on bicycle count data, including data provided by Eco-counter, a prominent provider of bicycle trip counters worldwide (Eco-Counter 2024). In Montreal, such data has been instrumental to assess the impact of the pandemic. Notably, Buehler and Pucher (2022) utilized this data in their analyses of annual changes in cycling ridership across 14 cities in Europe and North America. Their findings reveal a 10% decline in overall cycling volumes between 2019-2020 and a 3% increase in cycling volumes between 2019-2021 in Eastern Canada, with data primarily collected from sensors located in Montreal.
In this paper, we examine the quality of bicycle count data and propose improvements for its use in assessing the impact of the COVID-19 pandemic on cycling ridership, using the data available on the City of Montreal’s open data portal as an example. We recognize that the scope, context, and timeliness of earlier analyses may not have allowed for such a detailed examination nor for the imputation of missing values. However, we hope that by revisiting this data we can provide cities, including Montreal, with a more accurate understanding of how the COVID-19 pandemic has impacted cycling so they can plan accordingly.
2. Methods
Data for this study is collected from Eco-Counter sensors installed along bike lanes in Montreal from 2019-2023. The data is available on the City of Montreal’s open data portal (Ville de Montréal 2023) and includes the hourly cycling ridership levels recorded by each of the city’s 42 sensors.
In discussions with Eco-counter, we identified and removed three sensors with inaccurate data that could not be corrected through imputation. Additionally, they informed us that they regularly encounter difficulties in data collection due to sensor interference, vandalism, or sensor removal, which may lead to intervals where no data is collected. While the company offers an imputation service, using data from similarly behaving sensors to estimate cycling traffic during these periods of missing data, many cities, including Montreal, do not pay for this service. As a result, the raw data on the city’s open data portal contains numerous sensors with periods of missing data, which when used to compute yearly variations in cycling, can lead to inaccurate results.
To address this, previous studies opted to remove such sensors from their analyses. Instead, we employed the na_seasplit missing value imputation function from the ImputeTS R package (Moritz and Bartz-Beielstein 2017) to correct for periods of missing data and retain these sensors in our analysis. This approach, referred to as seasonally splitted missing value imputation, segments the time series into seasonal intervals based on weekly and monthly patterns, and applies linear interpolations independently to impute missing values within each defined interval. The performance and accuracy of the imputation were evaluated in terms of Root Mean Square Error (RMSE) as described by Moritz et al. (2015) and via visual inspection by the authors.
3. Findings
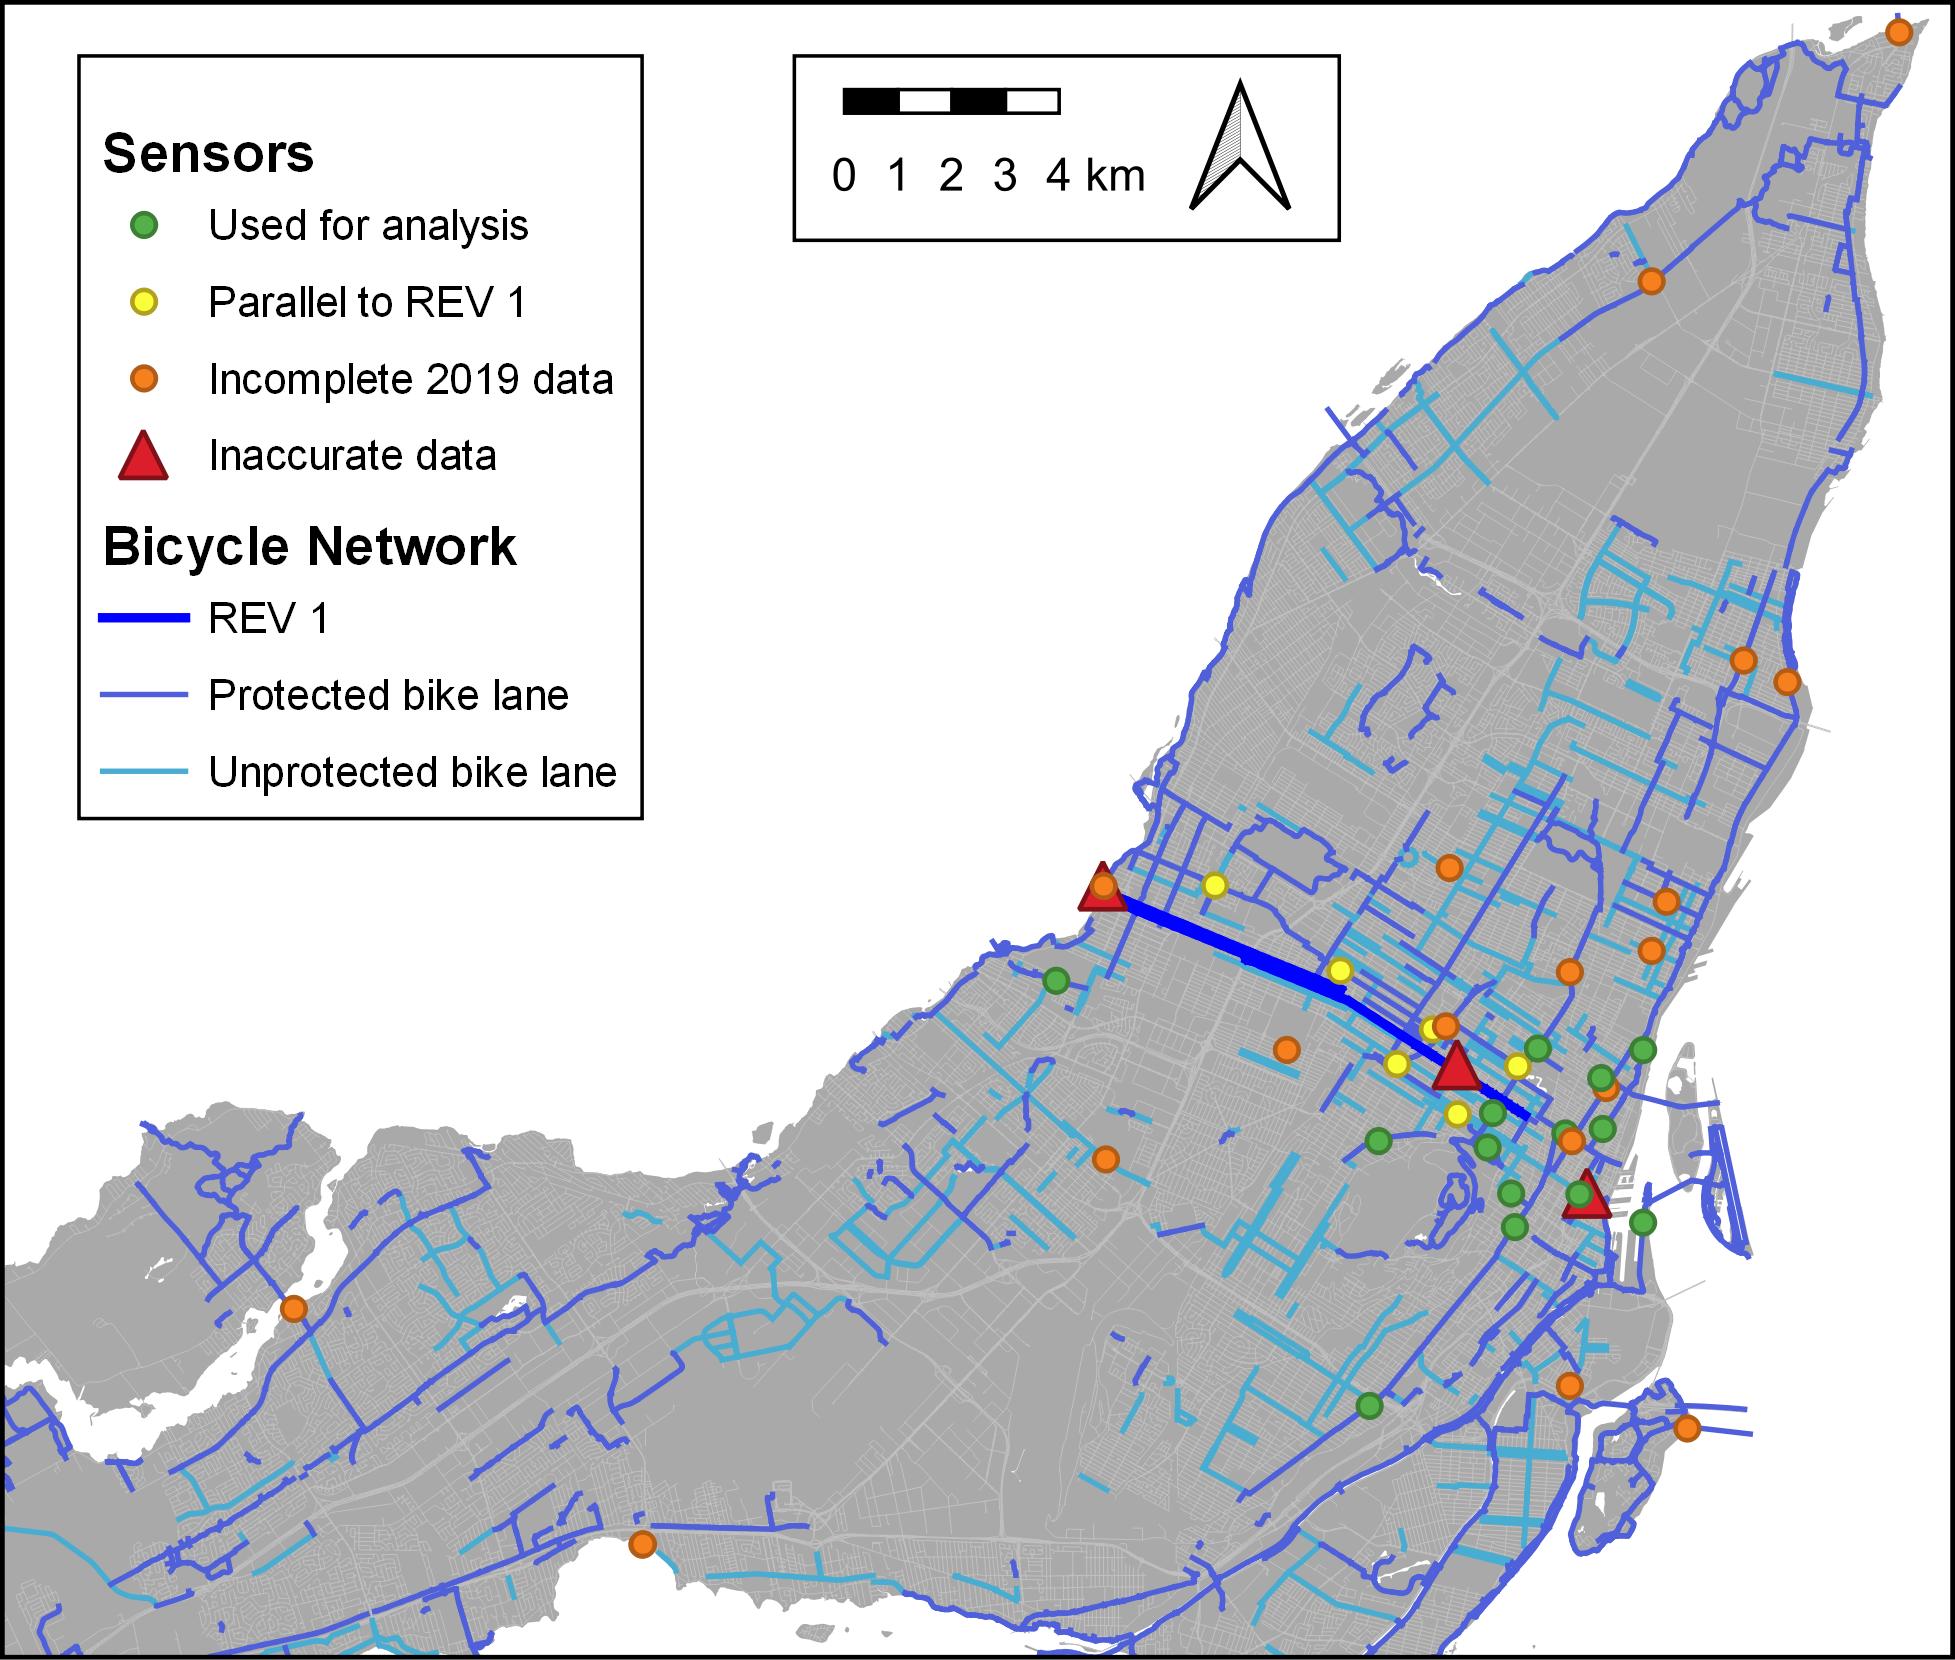
Figure 1 depicts a map of Eco-Counter sensors installed along bike lane in Montreal from 2019-2023. Of particular importance are those that were added to the network in 2019 (in orange), meaning they would have incomplete data for that period and that using them as a base year for comparison may have led to exaggerated changes in cycling ridership. Consequently, these sensors were removed from our analysis.

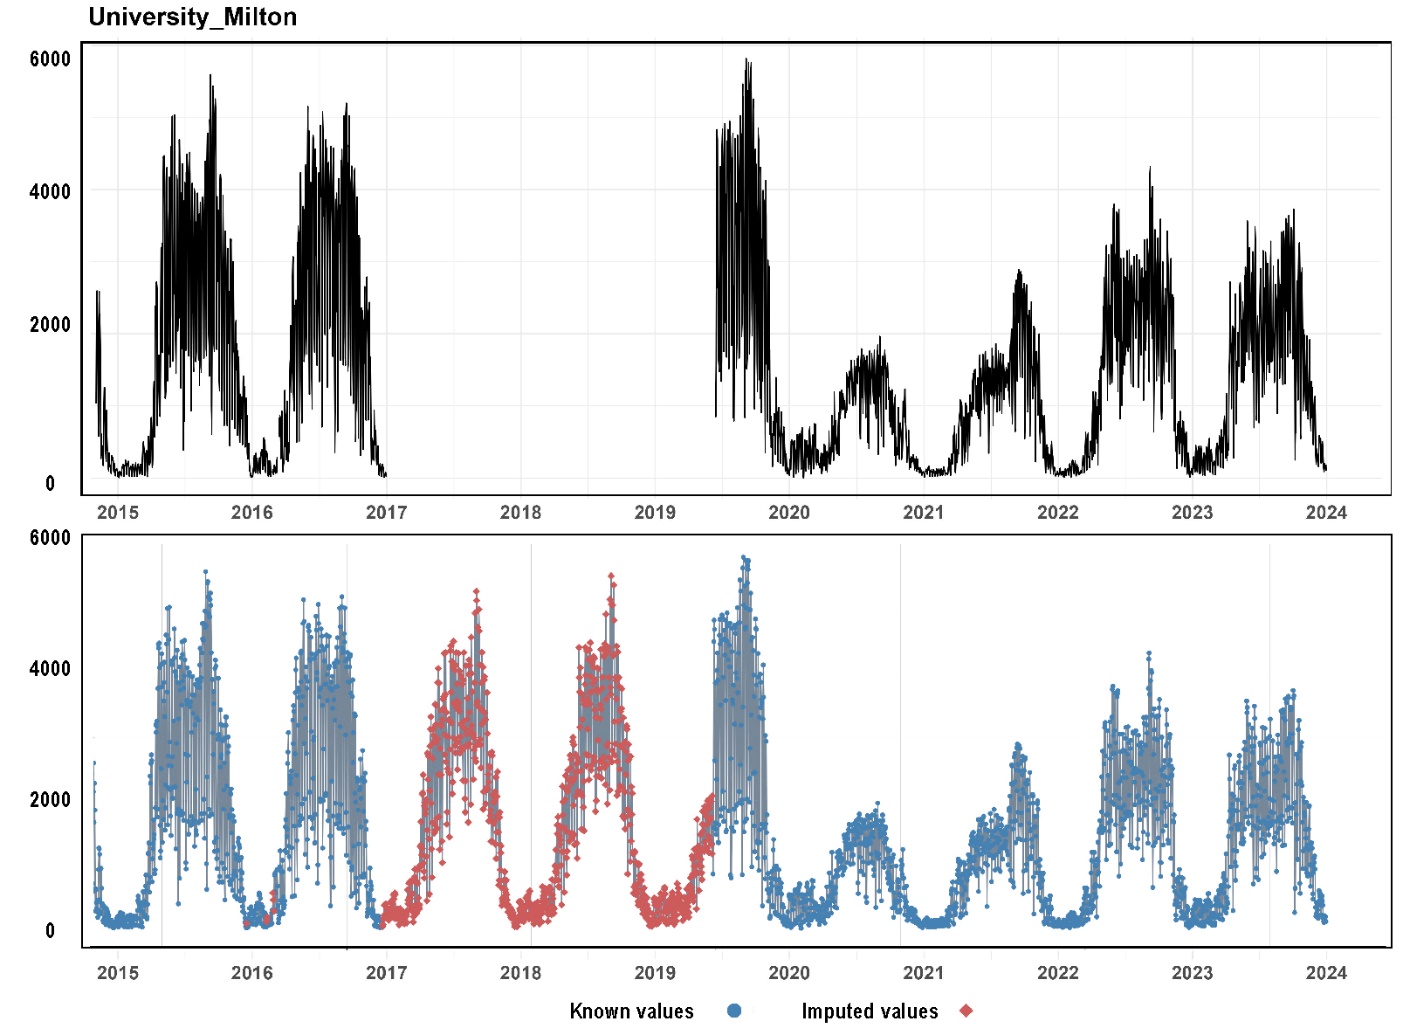
A crucial issue when using cyclist count data – or indeed any forms of data – is how to handle instances of missing data. For instance, Figure 2 (top) shows a sensor in Montreal with a noticeable interval of missing data, including in the earlier months of 2019, exemplifying how if used to compare ridership with subsequent years to establish the impact of the pandemic, may falsely indicate an increase in cycling volume when in fact a decrease is more likely. To resolve this issue, we present in Figure 2 (bottom) our chosen imputation strategy (na_seasplit function from the ImputeTS R package) that leverages seasonality and historical cycling counts to estimate cycling traffic during periods of missing data. While only a few sensors exhibited significant intervals of missing data, nearly all had periods of missing data that required corrections.

Also visible in Figure 1 is the newly introduced REV route along Berri/Lajeunesse/Saint-Denis streets. This high-capacity protected bike lanes separated from car traffic and with signalization designed to prioritize cyclists over cars, has rapidly become the city’s most popular cycling artery. However, as it was only introduced in November 2020 and does not have sensor data covering the period of 2019, it could not be included in earlier COVID-19 impact studies but does seem to have generated new cyclists (Young, MacGregor, and Tanguay, forthcoming). That said, sensor data from several adjacent parallel routes were included in prior studies to assess the impact of the pandemic on cycling, and by not accounting for cyclists that the REV may have displaced from adjacent bike lanes, their inclusion may provide a biased representation of the pandemic’s impact on cycling volumes in the city. As such, we redid the comparative temporal analyses excluding parallel bike lanes adjacent to the REV.
By removing these bike lanes and reintroducing sensors through our missing value imputation technique, we obtain markedly different results. Table 1 provides a comparison of Montreal cycling volume changes from 2019 to 2023. In addition to presenting results from different steps of our methodology, we include those obtained from the raw bicycle count data available on the city of Montreal’s open data portal. As shown in Table 1, the raw data indicates a constant increase in cycling volumes throughout the pandemic, with a 32.3% increase in 2023, compared to 2019. However, our analysis suggests a slower recovery period. Using the na_seasplit missing value imputation technique to correct for periods of missing data, we find that cycling volumes remain 13.4% below pre-pandemic levels in 2023. By further removing data collected from sensors parallel to the REV, we obtain comparable results for 2020 prior to the REV’s installation, but note a swifter recovery in subsequent years. This underscores the notion that failing to consider cyclists displaced by the REV may lead to a biased portrayal of the pandemic’s effect on cycling volumes in Montreal.
Cities like Montreal, in the process of expanding their cycling network, rely on accurate cycling trend data. However, there’s concern that inflated cycling figures could weaken and undermine the argument for further expansion. Such inaccuracies may fuel skepticism among cyclist opponents, who could seize the opportunity to discredit or point out incongruities in current cycling trend research. We hope this piece offers a more precise assessment of the changes in cycling volume in the years following the COVID-19 pandemic and provides insight that will aid cities in better planning for the future.
Data availability
The original data presented in the study are openly available at https://donnees.montreal.ca/dataset/reseau-express-velo. All the R code used in this paper is available on the author’s GitHub repository at https://github.com/Gavin-MacG/Cycling_Montreal.