1. Questions
To effectively combat the COVID-19 pandemic while simultaneously mitigating its economic and social consequences, a comprehensive set of policy measures has been implemented in many countries. For contributions describing mobility impacts in Japan we refer exemplary to Parady, Taniguchi, and Takami (2020), Suzuki and Utsumi (2021) and Sun, Schmöcker, and Nakao (2022). In Japan declarations of states of emergency were followed by Go-To-Travel campaigns which are national travel assistance campaigns providing discounts for hotels and dining-out at times when the thread of the pandemic appeared to be reasonably under control. The campaigns had the goal to encourage people to travel and revitalise regional tourism. Clearly cities and regions that depend on tourism were among those most affected by the pandemic and within these cities districts with restaurants and bars were those with largest financial losses and business closures. We aim to quantify the relationship between the visiting population in the areas and the pandemic related policies. More specifically, our questions are: What is the impact of policies on nightlife? Which type of land-use mix is losing more demand and recovering faster?
2. Methods
Our main data source is mobile spatial statistics obtained from “Docomo” a major cell phone provider in Japan. We obtained aggregate mesh data for Kyoto which provide us with hourly estimates of the number of people present in meshes of size 500m x 500m for the period 2019/11/1~2021/10/31. The data can be presumed to be accurate due to the large market penetration of this provider. The data further allow us to distinguish residents of Kyoto and those presumably visiting the city as the data contains an hourly estimate of people in the mesh who have registered their phones in Kyoto and those who have not. We focus on data from the downtown area and use the mobile spatial statistics for the hour 11:00 PM to midnight. A two-step method is used to answer our two questions. The visiting population estimate for the meshes at that hour is our target variable for Step 1. We aim to explain it using dummies that indicate seasons attracting tourists, implementation of COVID policies, weather conditions and the number of COVID cases. We hence try to separate the policy impacts from the impact of COVID itself. The full set of variables and the period when the policies are active is shown in Table 1.
The model is estimated for each mesh using regression models with ARIMA errors (RegARIMA), which is expressed in Equation (1) where denote the state of the variables on day t shown in Table 1. Variables and are COVID related, other variables are for control purposes.
\[y_{t,m} = \sum_{i = e1,\ldots,e5,g1,g2,s1,....,s8,r,c} {\beta_{m}^{i}x_{t}^{i}} + Z_{t,m} \tag{1}\]
denotes the change in night population on day t in mesh m compared to a baseline in October 2019. The 60 meshes in Nakagyo Ward of Kyoto City are selected as the observations, so that we have The parameters as well as the time series errors are fitted with an ARIMA (1,0,1) process that was found to fit best. The RegARIMA model specifies a time series process to the residuals only, therefore it addresses the serial correlation issue and keeps the significance of parameters (see Box et al. (2015) and Tsay (1984) for further RegARIMA discussion). The mean and range of the estimates for the 60 models are shown in Table 1. We acknowledge that the variation for some variables is high and that variables are not significant in all models, so that some of our results should be considered as tentative.
In Step 2, we aim to explain the variation in two specific policy parameters with land-use characteristics for the 60 meshes. We choose and estimated in Step 1, for this as the first State of Emergency and the second “Go-to-travel” campaign had more significant effects than other policies. We use a multiple linear regression model with spatial lag in this step and as explanatory variables points of interest (POIs) in the meshes that we obtained via searches with a Google Maps API. Google distinguishes 96 POI types from which we group the related POIs into 8 categories as shown in Table 2. The equation for is shown below where denotes the impact of POI category j and denotes the number of POIs of type j in mesh m. denotes the spatial weight which we define according neighbouring adjacency and is the estimated spatial lag.
\[\beta_{m}^{e1} = \sum_{j = Transit,\ldots,Hotel} {\gamma_{j}x_{j,m}} + \lambda\sum_{k = 1..N} {w_{ik}\beta_{k}^{e1}} + \varepsilon_{m} \tag{2}\]
3. Findings
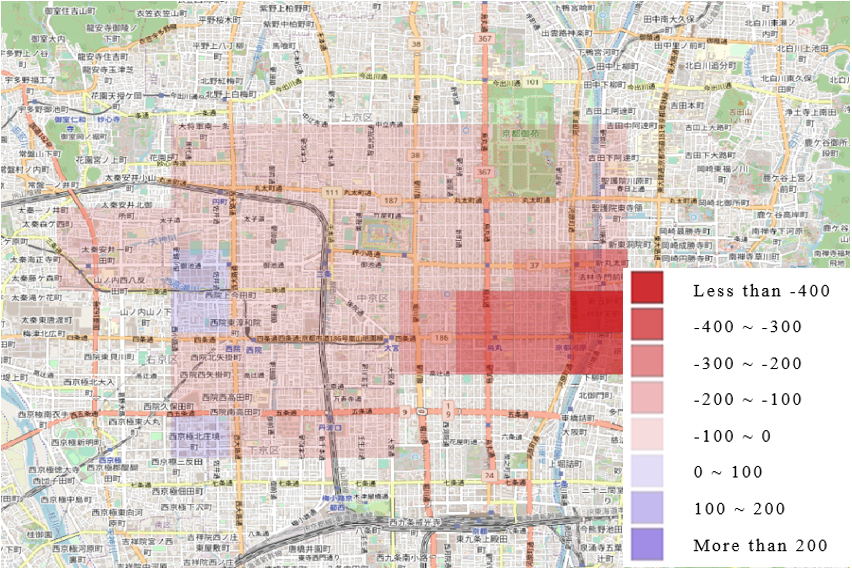
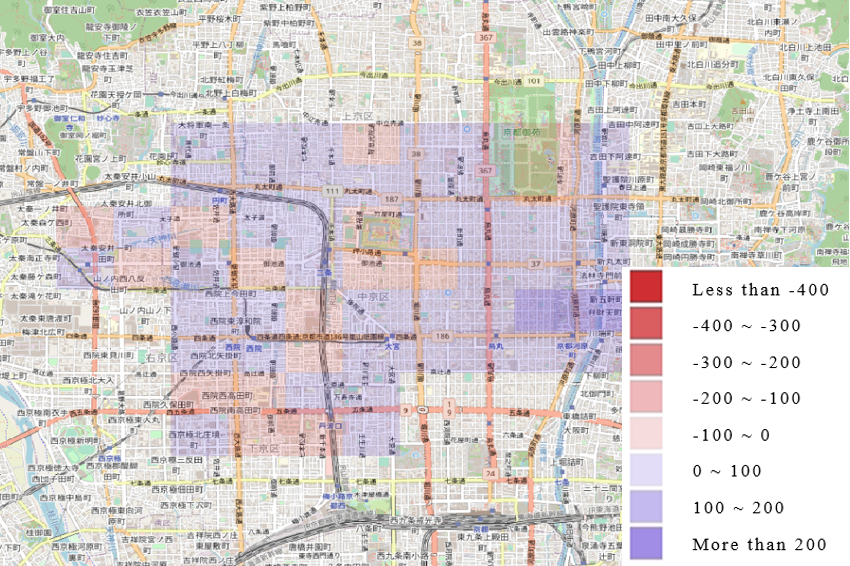
Figures 1 and 2 illustrate the results of the RegARIMA model for each mesh by showing the magnitude of the two policy parameters. The negative impact of the first emergency declaration of emergency (e1) at 11:00 PM was significant in the downtown meshes (Kawaramachi area), reducing 400 persons or more. Similarly, the impact of the second “Go-to-travel” Campaign (g2) has a larger positive impact on the downtown areas, although the impact magnitude is smaller than that of the emergency declaration. We conclude that, as expected, downtown areas are more susceptible to the impact of the policy, regardless of whether the impact is positive or negative. Noteworthy is the wide spread of the impacts even to meshes fairly away from the main nightlife district of Kyoto.


To obtain deeper insights we turn to the results of the multiple regression analysis (Table 3). The model is based on all 60 meshes, even if the policy parameter is not significant for some meshes. To gain some further trust in our results, we also run a model with highly insignificant variables (p>0.2) set to zero and obtain similar results. For our limited area of downtown Kyoto the model fit is high suggesting that land-use attributes can explain the impact of the policy measures. “Nightlife” and “Shopping” are negatively significant whereas “Food” and, on a 10% significance level, “Public facility,” are positively significant. The large negative impact of nightlife illustrates how the presence of nightlife establishments correlates with the impact of the emergency declaration. The results suggest that each nightlife POI is associated with a reduction of 11 persons in a mesh as a result of the emergency declaration. This number might sound not very significant, but we remind that many of the bars are small and that this is the additional impact due to the emergency declaration and to the general COVID impact. Furthermore, meshes depending on transit tend to suffer more from the state of emergency, but the effect is not statistically significant. The low impact of shopping facilities is understandable as at 11:00 PM only convenience stores are open. The positive impact of food POIs and the small positive impact of public facilities are noteworthy. We note that food includes take-aways which are more frequented during the emergency declaration. Public facilities might indicate simply that meshes with more diverse land-use are more robust.
For the “Go-to-travel” campaign we observe in general reversed signs, as we would expect. In line with Figure 2, the magnitude of the coefficients is smaller. Further, the relative magnitude of the coefficients varies significantly. “Nightlife” still has the largest magnitude, but the difference to other POI groups is largely reduced. The results suggest that due to the travel campaign, some visitors return but not many engage in nightlife activities. This is understandable given that the pandemic was not yet over and people might perceive going to bars as risky. Overall, our results imply that to overcome the impacts stronger incentives are needed. The Go-To campaign does lead to some, but relatively few, benefits for the nightlife industry. More generally, we suggest that our study demonstrates the importance of considering land-use mix data including what might appear to be minor POIs, to understand the spatially diverse impact of pandemic related policies.
Acknowledgements
This work was also supported by the EIG CONCERT-Japan DARUMA project,
Grant Number JPMJSC20C4 funded by JST SICORP, Japan.