1. QUESTIONS
Public transit ridership worldwide fell precipitously in the weeks following the onset of the COVID-19 pandemic in March 2020 (Qi et al. 2023; Erhardt et al. 2022; Fernández Pozo et al. 2022; Negm and El-Geneidy 2024; Wilbur et al. 2023). Canada was no exception. Within weeks, transit ridership and farebox revenues fell by 84 percent. A steady yet painfully slow recovery in transit ridership and revenues has been ongoing, putting significant pressure on transit operators to maintain service frequency and quality with limited resources. The extant literature on the pandemic’s impact on public transit is limited in scope. Most studies are based on small sample commuter surveys, focused on one or several transit operators, and, except for a few, most ignore the decline in farebox revenues (Shaheen and Wong 2023; Deb and Hinge 2023). The resulting gap leaves the following questions unanswered:
-
What is the aggregate national-level impact of the pandemic on transit ridership and revenues in Canada? Do subnational trends differ from the national picture?
-
What was the magnitude of the immediate decline in ridership and revenues following the start of the pandemic?
-
What is the aggregate national recovery rate for transit ridership since the pandemic?
2. METHODS
This study analyses time series data on public transit ridership and revenues collected by Statistics Canada. The transit survey gathers data on operating revenue (excluding subsidies) and passenger trips from urban transit companies representing at least 75% of revenue in each Canadian province and territory (Statistics Canada 2024b). Thus, the analysis accounts for three-fourths of urban transit operations in Canada.
The empirical analysis employs standard time series algorithms to address temporal autocorrelation and uses Interrupted Time Series Analysis (ITSA) to capture the immediate change in transit ridership and the post-intervention rate of change (Linden 2015).
3. FINDINGS
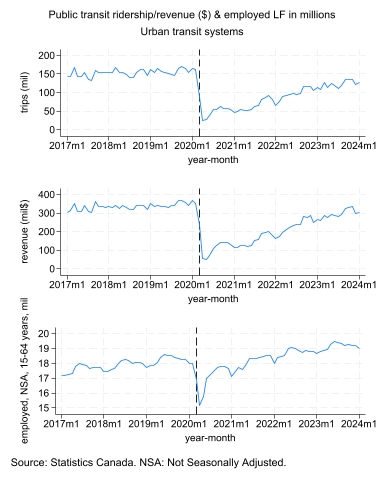
Figure 1 presents the drastic shifts in transit ridership and revenue before, during, and since the COVID-19 pandemic. Urban transit ridership averaged around 160 million trips, while farebox revenue averaged around $350 million dollars in months before the onset of the pandemic. However, pandemic-mandated mobility and assembly restrictions confined all except healthcare workers and those providing essential services to their homes, resulting in an 84 percent decline in ridership and revenues between February and April 2020.

The mobility and assembly restrictions were iteratively relaxed and tightened numerous times in the months following March 2020, resulting in transit ridership expanding and shrinking accordingly. The size of the employed labor force (15 to 64 years of age) is equally relevant to variations in public transit use such that urban transit ridership varied in step with fluctuations in the labor force (Figure 1).
Canada’s urban public transit ridership reached 127 million passenger trips in January 2024, recording a 12 percent year-over-year increase since January 2023. Since April 2021, transit ridership has reported a year-over-year increase in monthly ridership, showing a sustained recovery (Figure 1). Despite the persistent growth, ridership in January 2024 was 29 percent less than in January 2020. In comparison, urban transit revenues in nominal dollars reported a smaller decline of about 20 percent in January 2024 compared to January 2020. However, given the sharp increase in inflation since early 2022, one can expect a much larger decline in inflation-adjusted fare box revenues.
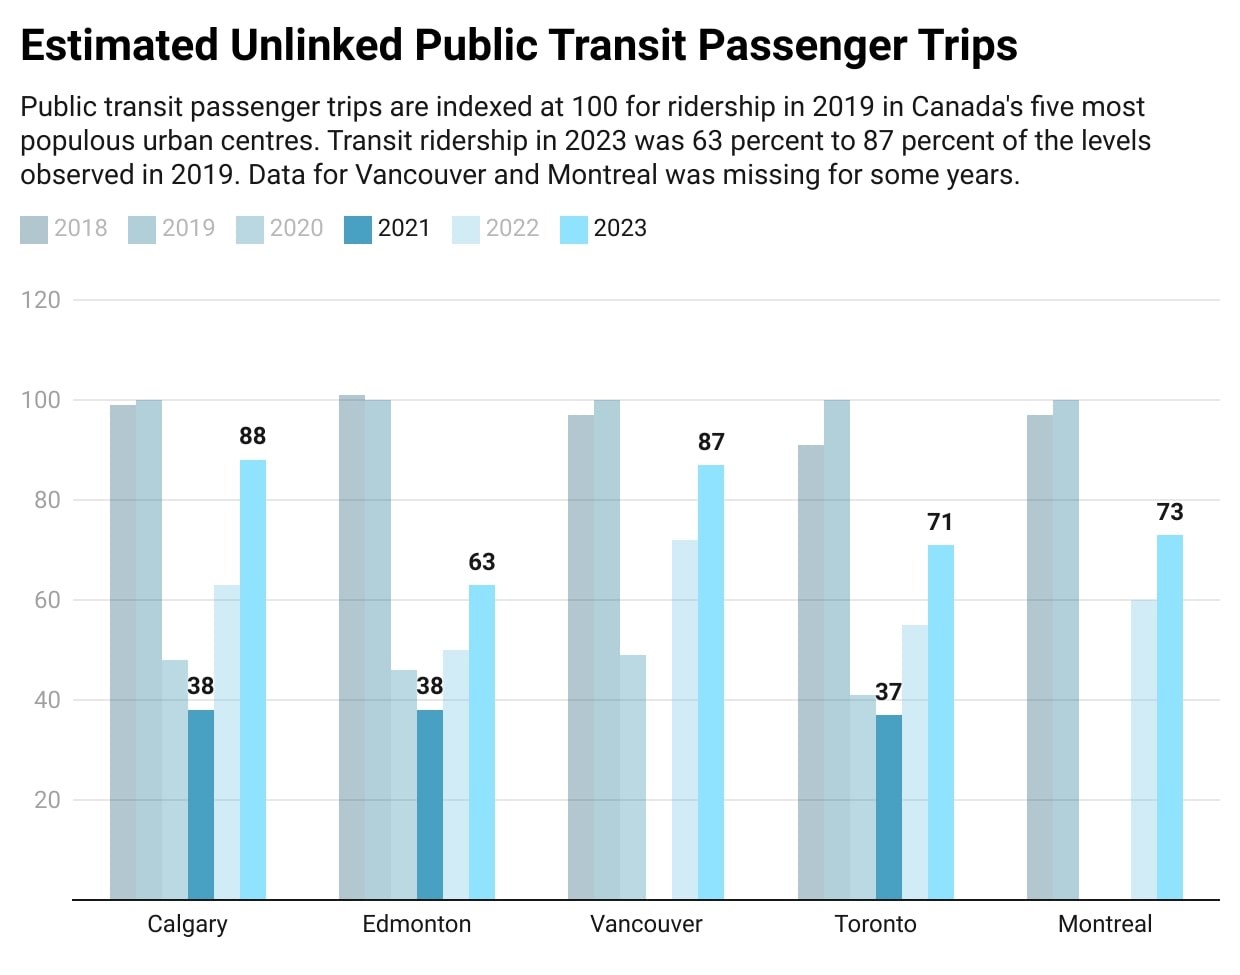
The operator-level ridership recovery shows a nuanced picture. The data extracted from the quarterly ridership reports published by the American Public Transportation Association indicate that cities with downtown-centric mobility patterns and underground rail-based transit are experiencing slower recovery rates. Figure 2 illustrates recovery rates for Canada’s five most populous cities, where 2023 ridership counts reached between 63% and 87% of the 2019 levels. In contrast, some smaller municipal transit systems met or exceeded pre-pandemic ridership numbers. Notably, the City of Brampton, a suburb of 700,000 people bordering Toronto, doubled its ridership in 2023 compared to 2019.

Urban transit ridership is influenced by, among others, changes in population and labor force (Hendrickson 1986). Furthermore, mobility in urban centers in Canada is mostly dominated by private automobile and public transit modes, with non-motorized modes comprising a much smaller mode share. For instance, the 2021 Census data revealed that in Toronto, Canada’s most populous metropolis, private automobiles accounted for 61 percent of commute trips, followed by public transit at 26 percent and active modes of transportation at 10 percent (Statistics Canada 2023).
I present a brief overview of how transit-influencing factors evolved over time when public transit experienced huge swings in patronage (Table 1). While the urban transit ridership was decimated at the onset of the pandemic, the employed labor force also contracted by 16 percent. However, the labor market recovery was more pronounced, and by January 2024, Canada’s labor force had increased by five percent over the January 2020 levels. Similarly, the country’s population grew by four percent over the same period.
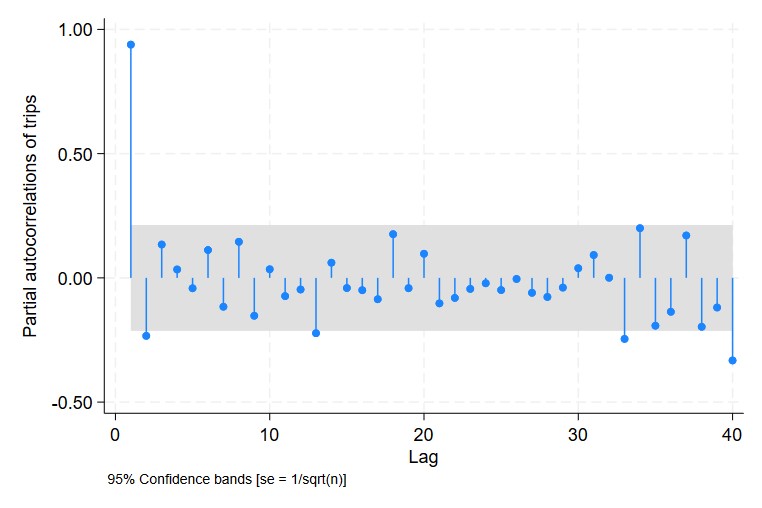
This analysis indicates that while labour markets and demographics have recovered from pandemic lows, transit ridership and farebox revenues remain below pre-pandemic levels. The Interrupted Time Series Analysis (ITSA) estimates the pandemic’s impact on transit ridership and its recovery. Coefficients are estimated using Ordinary Least Squares, with Newey-West standard errors robust to serial autocorrelation and heteroskedasticity (Linden 2015). The Partial Autocorrelation Function suggests up to two lags in the ridership data (Figure 3).
The ITSA, without controlling for population and labor force, reveals pre-pandemic ridership of 147 million trips growing at 0.35 million trips per month. The pandemic caused an immediate decline of 122.7 million trips, followed by a post-pandemic growth of 1.75 million trips per month. At this rate, Canada is expected to reach pre-pandemic ridership levels of 169 million trips by January 2026. Given Canada’s recent population growth, recovering to pre-pandemic ridership will serve a much larger population, resulting in a lower population-adjusted ridership rate (Statistics Canada 2024a). The second parametrization with additional controls suggests that population and labor force are not statistically significant predictors of transit trips over time (Table 2).

In summary, Canada’s underlying labor markets and demographics have grown past the pre-pandemic levels. However, urban transit ridership in Canada is still markedly lower than the pre-pandemic levels and may take another two years to reach them. The significant shift to working from home (telework) is partly the reason for the sustained decline in urban transit use in Canada (Haider and Iqbal 2022).
ACKNOWLEDGEMENTS
The author would like to acknowledge the Urban Analytics Institute at the Ted Rogers School of Management at the Toronto Metropolitan University for research support. Haver Analytics is recognized for providing ready access to data, while Statistics Canada and the American Public Transportation Association (APTA) are acknowledged for making data available to the larger academic and research community. Advice from Dr. Pei-Chun Lai at Stata Corporation and Professor Nicholas Cox at Durham University, UK, was instrumental in revising charts and visualizations. Meet Shah helped download data from APTA’s web portal for which I remain grateful.