Loading [Contrib]/a11y/accessibility-menu.js
Skip to main content
null
Findings
  • Menu
  • Articles
    • Energy Findings
    • Resilience Findings
    • Safety Findings
    • Transport Findings
    • Urban Findings
    • All
  • For Authors
  • Editorial Board
  • About
  • Blog
  • covid-19
  • search

RSS Feed

Enter the URL below into your favorite RSS reader.

https://findingspress.org/feed
Transport Findings
April 27, 2024 AEST

Evaluating Road Crash Severity Prediction with Balanced Ensemble Models

Alexei Roudnitski,
Machine LearningEnsemble ModelsCrash Severity
Copyright Logoccby-sa-4.0 • https://doi.org/10.32866/001c.116820
Findings
Roudnitski, Alexei. 2024. “Evaluating Road Crash Severity Prediction with Balanced Ensemble Models.” Findings, April. https:/​/​doi.org/​10.32866/​001c.116820.
Save article as...▾
Download all (3)
  • Figure 1. Feature Importance
    Download
  • Figure 2. Feature Importance
    Download
  • Figure 3. Model Performance Results
    Download

Sorry, something went wrong. Please try again.

If this problem reoccurs, please contact Scholastica Support

Error message:

undefined

View more stats

Abstract

This study evaluates the performance of an ensemble of five ML models (Random Forest, XGBoost, AdaBoost, LightGBM and CatBoost) on crash data from New South Wales, Australia. The model is evaluated based on ROC-AUC score, with a result of 0.68, indicating a moderate level of predictive accuracy. Feature importance analysis reveals the key predictors being the vehicle type involved, with sedans/hatchbacks and motorcycles being the most common in fatal crashes, and the collision type, with vehicle-to-object impacts often leading to fatalities. Furthermore, fatal crashes occur more on Saturdays, in country non-urban LGAs and speed limits of 100 km/h as the most usual settings for fatal accidents.

1. Questions

Machine learning algorithms have emerged as integral tools in transport research, particularly in the field of crash severity prediction (Malik et al. 2021; Yan and Shen 2022; Yang, Zhang, and Feng 2022), contributing to the reduction of car crash accidents with the design of safety campaigns, improved traffic laws, advancements in vehicle safety and traffic management systems (Fisa et al. 2022). In addition, crash severity prediction, utilizing machine learning models, can be used to optimize emergency medical services allocation by identifying injury severity. Determining the most effective models for injury severity prediction is crucial for resource allocation. Moreover, understanding critical factors in crash severity prediction can contribute to reducing accident occurrences, enhancing overall road safety strategies.

2. Methods

The data for this study covering the time period of 2018-2022 was obtained from the portal of the NSW Department of Transport (https://opendata.transport.nsw.gov.au/dataset/nsw-crash-data), with 20 variables and 57,240 observations selected. Variables associated with specific locations, IDs, or a high percentage of missing data were excluded to prevent potential overfitting. Additionally, variables irrelevant to this research, such as school zones, or those containing post-crash information like the number of injuries or fatalities, which could bias severity predictions, were omitted. Descriptions for each value utilized in the study were sourced from the portal’s manual and are provided in Table 1 below.

Table 1.Description of Variables
Variable Name Description Values
Degree of crash - detailed (dependent) The severity classification (or degree) of the crash, incorporating injury severity Fatal
Serious Injury
Moderate Injury
Minor/Other Injury
Non-casualty (towaway)
Day of week of crash (independent) The day of the week the crash occurred Sunday
Monday
Tuesday
Wednesday
Thursday
Friday
Saturday
Distance (independent) The distance in meters from the identifying feature used to locate the crash Numerical
Identifying feature type* (independent) The type of the identifying feature used to locate the crash Hwy (Highway)
Ave (Avenue)
Bdge (Bridge)
Bvd (Boulevard)
St (Street)
Rd (Road)
... (Others)
Type of location (independent) The type of location where the crash occurred Cross-intersection
Y-junction
T-junction
Multiple intersection
Roundabout
L-junction
One-way street
2-way undivided
Divided road
Single limited access
Dual freeway
Other
Urbanisation (independent) The urbanisation where the crash occurred Sydney metropolitan area
Newcastle metropolitan area
Wollongong metropolitan area
Country urban areas
Country non-urban areas
Alignment (independent) The road alignment of the road at the location of the crash Straight
Curved
Street Lighting (independent) The status of street lighting at the time of the crash On
Off (lights present but off)
NaN
Road Surface (independent) The type of road surface at the crash location Sealed
Unsealed
Surface Condition (independent) The condition of the road surface at the crash location Wet
Dry
Snow or ice
Weather (independent) The weather conditions at the time of the crash Fine
Raining
Overcast
Fog or mist
Snowing or sleeting
Other (e.g. hail)
Natural Lighting (independent) The natural lighting at the time of the crash Dawn
Daylight
Dusk
Darkness
Signals operations (independent) The operating status of the traffic control signals at the crash location On (signal installed and operating)
Off (signal installed but not operating)
NaN (no signals installed)
Other traffic control (independent) A traffic control other than traffic signals, that is in control at the crash location Pedestrian crossing
Stop sign
Give way sign
Police
No right turn
No left turn
Left turn only (from 2014)
Left turn on red after stop (from 2014)
No U turn
No entry / wrong way
Rail crossing with flashing signals
Rail crossing with stop sign
Rail crossing with no signals or stop sign
Road / railway worker
Other traffic control
No traffic controls
Speed limit (independent) The maximum speed limit applicable at the crash location 10 km/h
20 km/h
...
110 km/h
Road classification (independent) The administrative classification of the type of road on which the crash occurred Local
Regional
State
First impact type (independent) The type of first impact Vehicle - Vehicle (Head-on)
Vehicle - Vehicle (Right angle)
Vehicle - Vehicle (Nose tail)
Vehicle - Vehicle (Other angle)
Vehicle - Object
Vehicle - Pedestrian
Vehicle - Animal
Vehicle - Train / Aeroplane
Vehicle - Rollover
Person - object
Key TU type* (independent) The traffic unit type of the Key traffic unit in the crash (based on involvement in the first impact) Car (sedan/hatch)
Coach
Light truck
Passenger van
Tram
Pedal cycle
Quad bike
Station wagon
Train
...
Other TU type* (independent) The traffic unit type of the Other traffic unit involved in the first impact (if it exists) Same as Key TU type
NaN
No. of traffic units involved (independent) The actual number of traffic units involved (road vehicles and pedestrians) Numerical

* Note: Due to the large number of values for ‘Identifying feature type’, ‘Key TU type’ and ‘Other TU type’ the specific values can be found in the excel dataset attached.

For our dependent variable (‘Degree of crash - detailed’), the classes are separated into ‘Fatal’ with 1,423 observations (2.5%), ‘Minor/Other injury’ with 7,582 observations (13.3%), ‘Moderate injury’ with 20,349 observations (35.6%), ‘Serious injury’ with 18,115 observations (31.6%) and ‘Non-casualty (towaway)’ with 9,771 observations (17%). This distribution suggests that our data is imbalanced, potentially leading to biased predictions that neglect minority classes. To address this, we are using SMOTE (Synthetic Minority Over-sampling Technique), which generates synthetic instances of underrepresented classes by interpolating existing ones. This approach aims to balance the dataset, enhancing the robustness and accuracy of our model in handling diverse crash severity cases while minimizing bias towards the majority class. (Chawla et al. 2002).

Utilizing a 70% train, 30% test data split, we apply an ensemble model of: Random Forest, XGBoost, AdaBoost, LightGBM and CatBoost. These models were chosen due to their robust generalizability and reduced overfitting abilities (Hastie, Tibshirani, and Friedman 2009). These models will employ a soft voting mechanism, where the final prediction is based on the weighted average of probability estimates from each model, enhancing overall prediction reliability. Hyperparameter tuning will further refine these models, and optimize their performance. Table 2 below provides an overview of each model used in the analysis, and a list of the optimal hyperparameters identified through the grid search process.

Table 2.Description of Machine Learning models
Model name Short Description Optimal Hyperparameters
Random Forest (RF) RF is an ensemble learning method that builds multiple decision trees and integrates their outcomes to improve prediction accuracy and control over-fitting (Breiman 2001). Max Depth= 10
Min Samples Leaf= 1
Min Samples Split= 2
N Estimators= 100
Extreme gradient boosting (XGBoost) XGBoost refines gradient boosting, which builds models sequentially to correct previous errors, by adding regularization to enhance performance on complex datasets (Chen and Guestrin 2016). Learning Rate= 0.1
Max Depth= 3
Min Child Weight= 1
N Estimators= 100
Adaptive boosting (AdaBoost) AdaBoost is an ensemble technique that adjusts weights of the learners, focusing more on difficult cases to improve the aggregate performance of the model (Freund and Schapire 1997). Learning Rate= 0.1
N Estimators= 50
Light gradient-boosting machine (LightGBM) LightGBM leverages gradient boosting algorithms but is optimized for higher efficiency and lower memory usage, making it suitable for large-scale data processing (Ke et al. 2017). Learning Rate= 0.1
Max Depth= 3
N Estimators= 100
Categorical boosting (CatBoost) CatBoost addresses categorical data transformation challenges, enhancing model training and accuracy without extensive data pre-processing (Prokhorenkova et al. 2018). Learning Rate= 0.1
Max Depth= 3
N Estimators= 100

Since the dataset was balanced using SMOTE, traditional measures like accuracy will not be incorporated due to its limitations in reflecting the true predictive power of the model, especially in scenarios where class distribution has been artificially altered. Instead, we will evaluate model performance using precision, recall, F1 score, and AUC-ROC score. The AUC-ROC (Area under the Receiver Operating Characteristic curve), assesses the model’s discriminative power to differentiate between classes at various thresholds, providing an extensive evaluation of its effectiveness in classifying balanced data. (Bradley 1997).
In addition, feature importance will be computed by weighting the importance scores from each model proportional to their AUC-ROC scores (Wang and Tang 2009), followed by averaging and normalization of these values. This method ensures that the contribution of each feature is weighted according to the model’s performance. Furthermore, we will identify the most common variables among the top three features, as well as additional selected features, in instances of fatal crashes. This approach aims to isolate the key factors that significantly elevate crash severity, guiding preventive measures more effectively.

3. Findings

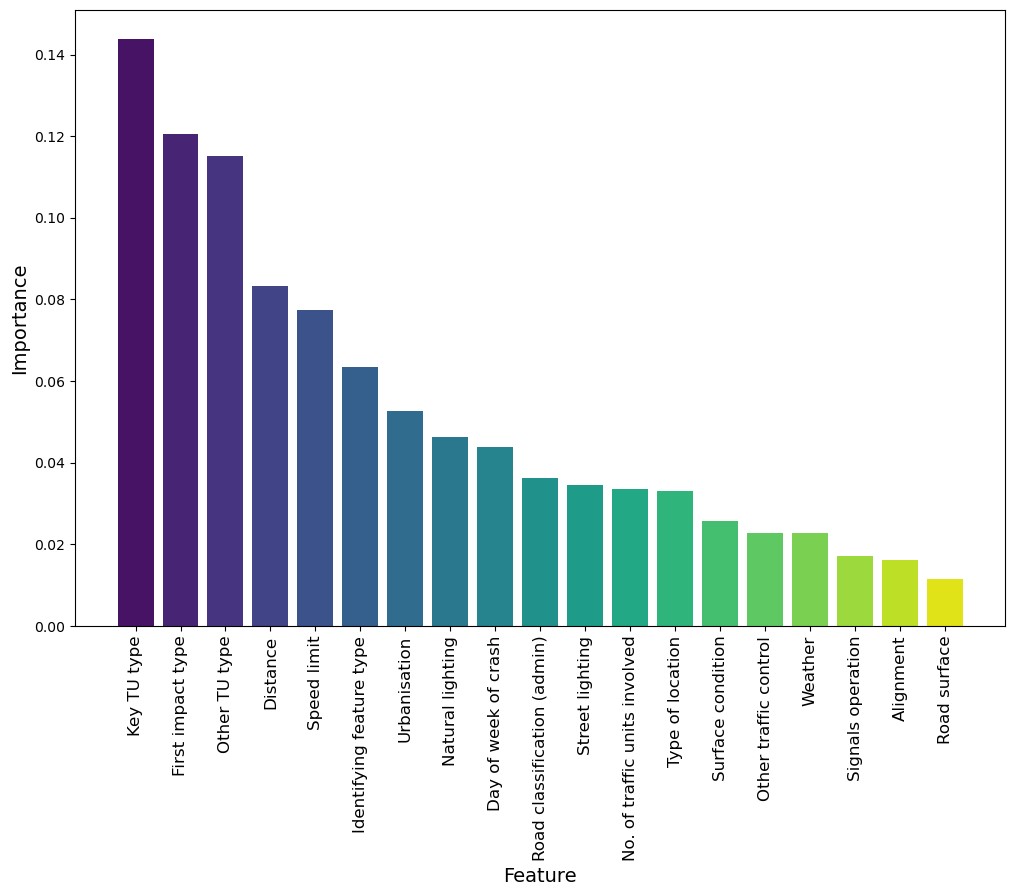
We begin our findings with feature importance, revealing ‘Key Traffic Unit Type’ as the leading indicator, reflecting the substantial role of the primary vehicle involved in the crash. Subsequently, ‘First Impact Type’ is identified as the second most critical feature, indicating the initial collision’s manner is also a major factor in the severity of the crash. As would be expected based on the previous two features, ‘Other Traffic Unit Type’ ranks third, acknowledging the influence of additional parties involved in the incident.

Figure 1
Figure 1.Feature Importance

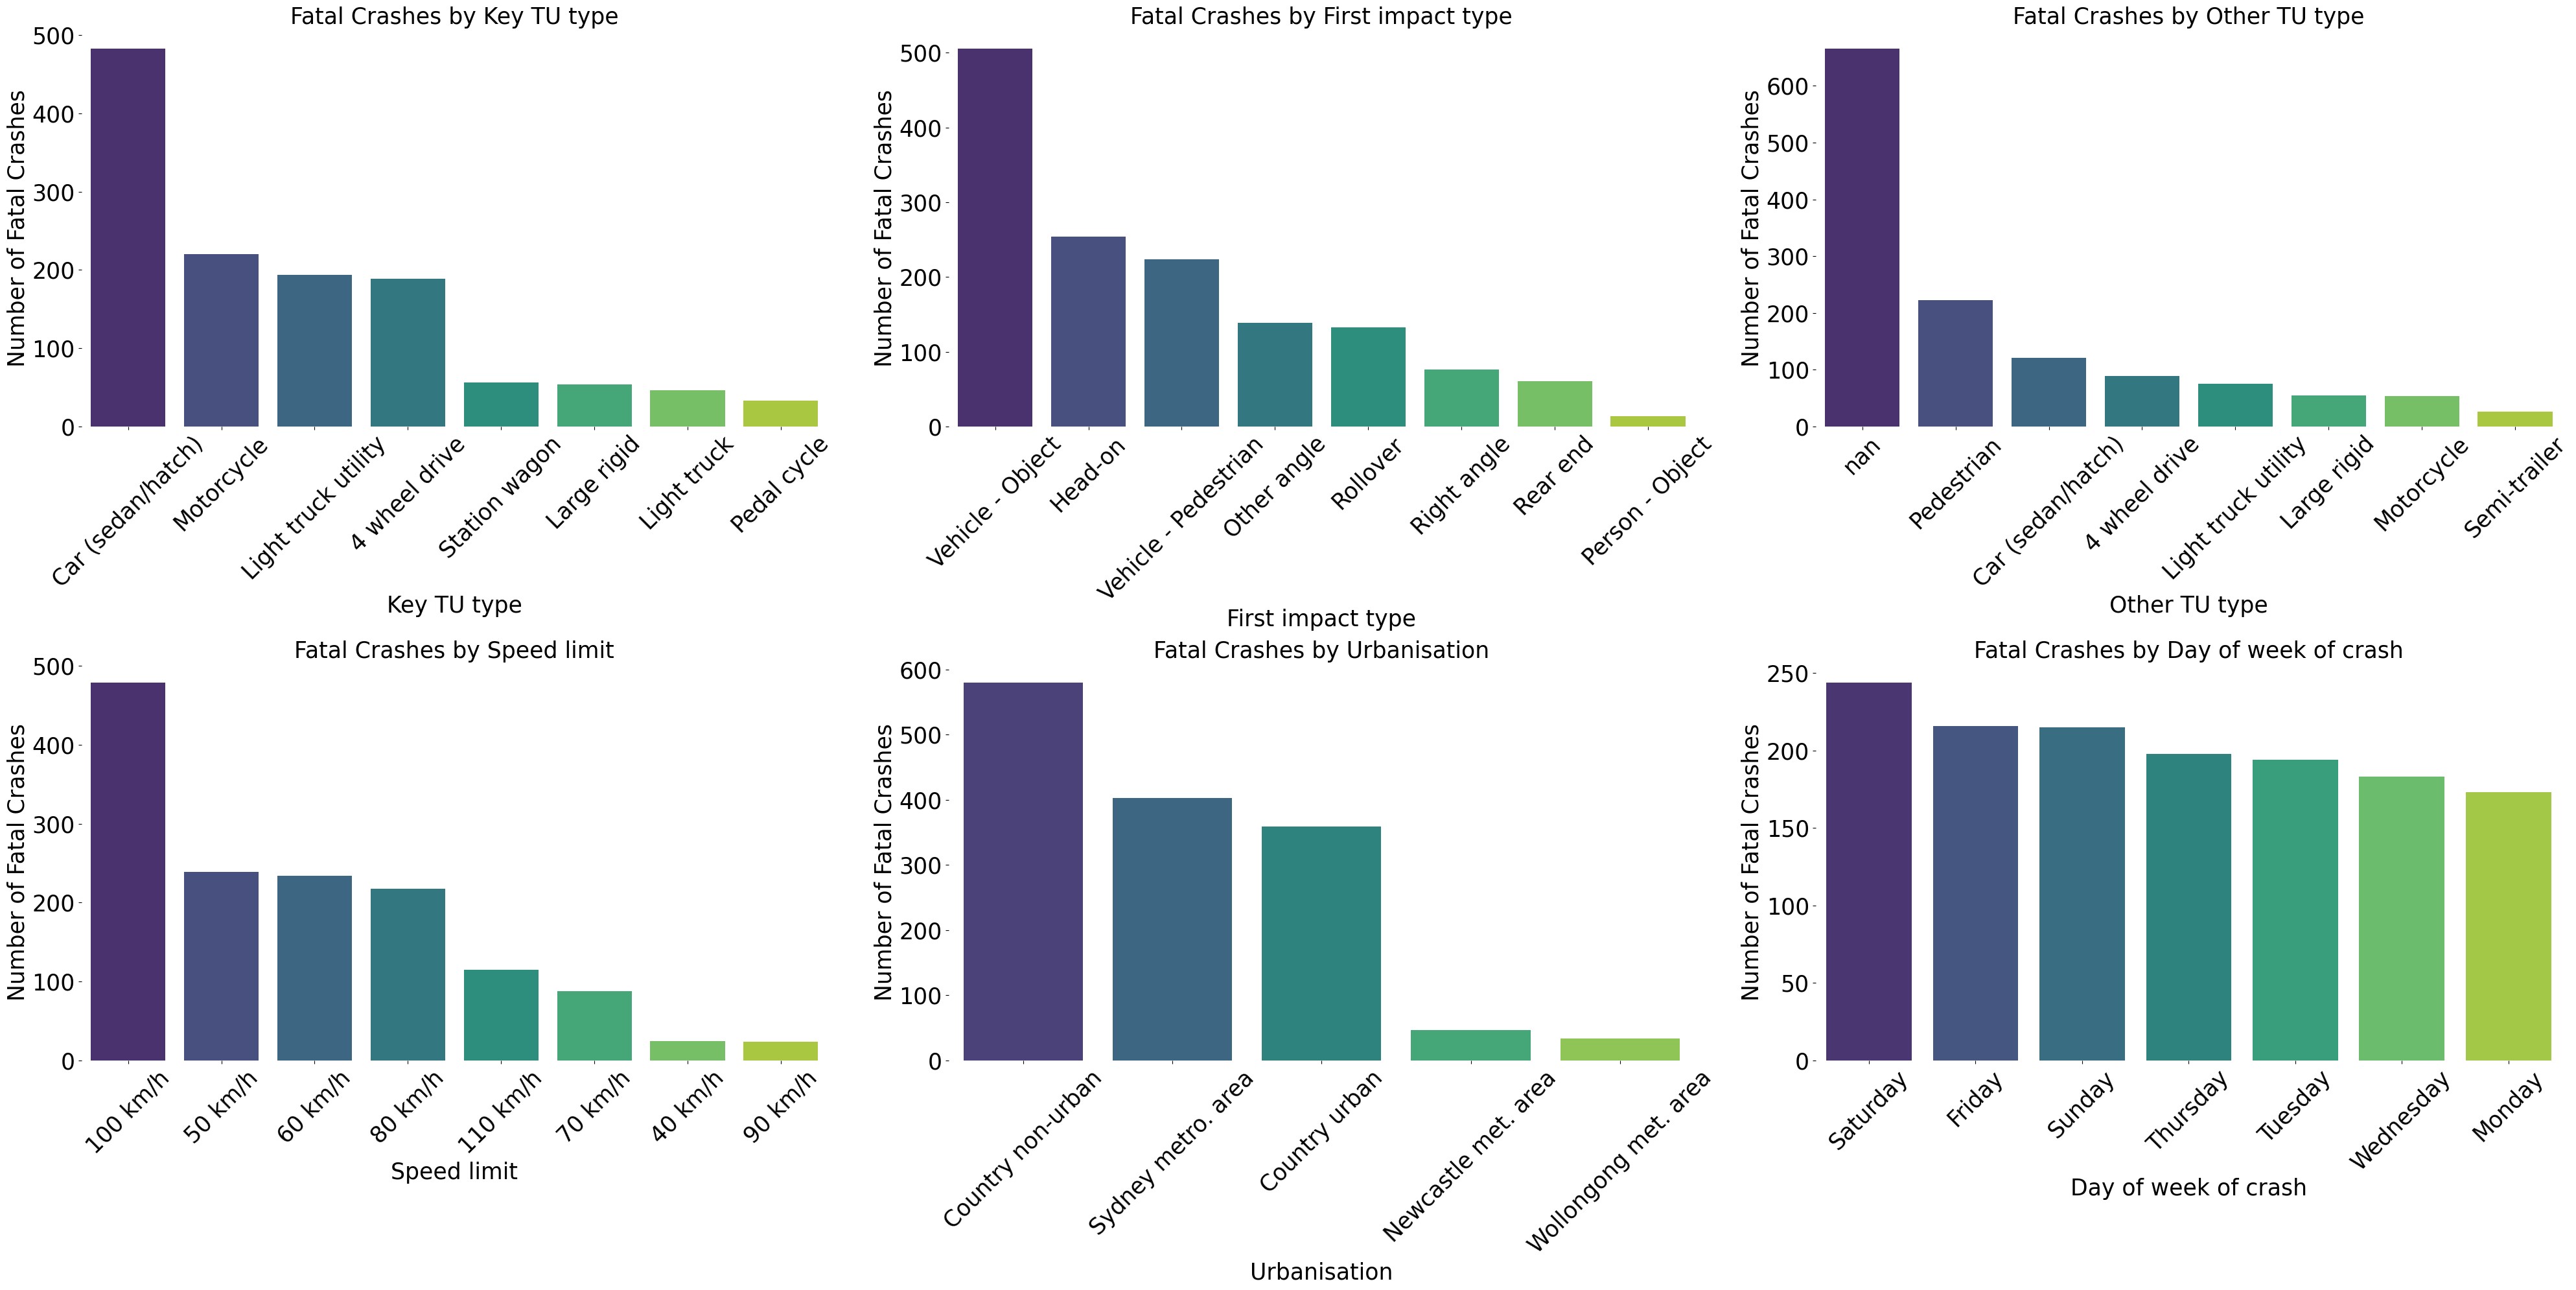
The analysis of common variables in fatal crash instances (Figure 2) shows that sedans/hatchbacks, motorcycles, and light trucks are most frequently involved. The primary impact types are vehicle-to-object and head-on collisions, with pedestrians often appearing as a prominent secondary factor (since vehicle-to-object collisions are the most frequent, the expectation of no secondary traffic unit involvement as the top choice is reasonable). The day of the week, speed limit, and urbanization were selected as additional features due to their relevance in shaping policies aimed at enhancing road safety and emergency response accessibility. The findings suggest that, fatal crashes occur more on weekends specifically on Saturdays, particularly in country non-urban Local Government Areas (LGAs) and Sydney metropolitan area, with speed limits of 100 km/h and 50 km/h being the most usual settings for such accidents.

Figure 2
Figure 2.Feature Importance

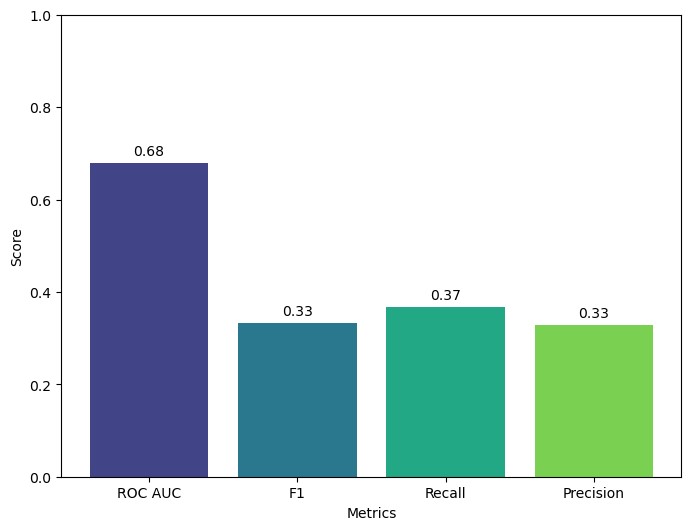
Based on a model evaluation across four metrics depicted in Figure 3 below, the ROC-AUC score reached 0.68, indicating a moderate capability of the model to distinguish between classes. Additionally, the F1 score, Recall, and Precision remained consistent, with respective scores of 0.33, 0.37, and 0.33, reflecting a moderate-to-low performance in identifying true positives and true negatives. These findings highlight the model’s reasonable discriminative ability while also suggesting opportunities for improvement in its predictive balance.

Figure 3
Figure 3.Model Performance Results

In conclusion, our analysis presents the predictive accuracy of an ensemble of selected machine learning models and key variables influencing crash severity, offering valuable insights for traffic safety enhancement. While factors like ‘Key TU type’ and ‘First impact type’ significantly impact crash outcomes, further research should explore the less influential variables such as ‘Surface condition’ and ‘Signals operation’. Future work could integrate more granular data, such as driver behavior or vehicle condition, and employ advance machine learning methods such as SVM and data balancing techniques such as ADASYN or SMOTE-Tomek to refine predictive accuracy. This ongoing research can be significant in developing targeted strategies to reduce road accidents and enhance public safety.

Submitted: March 21, 2024 AEST

Accepted: April 21, 2024 AEST

References

Bradley, Andrew P. 1997. “The Use of the Area under the ROC Curve in the Evaluation of Machine Learning Algorithms.” Pattern Recognition 30 (7): 1145–59. https:/​/​doi.org/​10.1016/​s0031-3203(96)00142-2.
Google Scholar
Breiman, Leo. 2001. Machine Learning 45 (1): 5–32. https:/​/​doi.org/​10.1023/​a:1010933404324.
Google Scholar
Chawla, N. V., K. W. Bowyer, L. O. Hall, and W. P. Kegelmeyer. 2002. “SMOTE: Synthetic Minority over-Sampling Technique.” Journal of Artificial Intelligence Research 16 (June):321–57. https:/​/​doi.org/​10.1613/​jair.953.
Google Scholar
Chen, Tianqi, and Carlos Guestrin. 2016. “Xgboost: A Scalable Tree Boosting System.” In Proceedings of the 22nd Acm Sigkdd International Conference on Knowledge Discovery and Data Mining, 785–94. ACM. https:/​/​doi.org/​10.1145/​2939672.2939785.
Google Scholar
Fisa, Ronald, Mwiche Musukuma, Mutale Sampa, Patrick Musonda, and Taryn Young. 2022. “Effects of Interventions for Preventing Road Traffic Crashes: An Overview of Systematic Reviews.” BMC Public Health 22 (1): 513. https:/​/​doi.org/​10.1186/​s12889-021-12253-y.
Google ScholarPubMed CentralPubMed
Freund, Yoav, and Robert E Schapire. 1997. “A Decision-Theoretic Generalization of on-Line Learning and an Application to Boosting.” Journal of Computer and System Sciences 55 (1): 119–39. https:/​/​doi.org/​10.1006/​jcss.1997.1504.
Google Scholar
Hastie, Trevor, Robert Tibshirani, and Jerome Friedman. 2009. The Elements of Statistical Learning. Springer New York.
Google Scholar
Ke, Guolin, Qi Meng, Thomas Finley, Taifeng Wang, Wei Chen, Weidong Ma, Qiwei Ye, and Tie-Yan Liu. 2017. “Lightgbm: A Highly Efficient Gradient Boosting Decision Tree.” In Advances in Neural Information Processing Systems. Vol. 30.
Google Scholar
Malik, Sumbal, Hesham El Sayed, Manzoor Ahmed Khan, and Muhammad Jalal Khan. 2021. “Road Accident Severity Prediction — A Comparative Analysis of Machine Learning Algorithms.” In 2021 IEEE Global Conference on Artificial Intelligence and Internet of Things (GCAIoT), 69–74. IEEE. https:/​/​doi.org/​10.1109/​gcaiot53516.2021.9693055.
Google Scholar
Prokhorenkova, Liudmila, Gleb Gusev, Aleksandr Vorobev, Anna Veronika Dorogush, and Andrey Gulin. 2018. “CatBoost: Unbiased Boosting with Categorical Features.” Advances in Neural Information Processing Systems 31.
Google Scholar
Wang, Rui, and Ke Tang. 2009. “Feature Selection for Maximizing the Area under the ROC Curve.” In 2009 IEEE International Conference on Data Mining Workshops, 400–405. IEEE. https:/​/​doi.org/​10.1109/​icdmw.2009.25.
Google Scholar
Yan, Miaomiao, and Yindong Shen. 2022. “Traffic Accident Severity Prediction Based on Random Forest.” Sustainability 14 (3): 1729. https:/​/​doi.org/​10.3390/​su14031729.
Google Scholar
Yang, Zekun, Wenping Zhang, and Juan Feng. 2022. “Predicting Multiple Types of Traffic Accident Severity with Explanations: A Multi-Task Deep Learning Framework.” Safety Science 146 (February):105522. https:/​/​doi.org/​10.1016/​j.ssci.2021.105522.
Google Scholar

This website uses cookies

We use cookies to enhance your experience and support COUNTER Metrics for transparent reporting of readership statistics. Cookie data is not sold to third parties or used for marketing purposes.

Powered by Scholastica, the modern academic journal management system