Loading [Contrib]/a11y/accessibility-menu.js
Skip to main content
null
Findings
  • Menu
  • Articles
    • Energy Findings
    • Resilience Findings
    • Safety Findings
    • Transport Findings
    • Urban Findings
    • All
  • For Authors
  • Editorial Board
  • About
  • Blog
  • covid-19
  • search

RSS Feed

Enter the URL below into your favorite RSS reader.

http://localhost:17716/feed
Urban Findings
April 24, 2024 AEST

The Roles of Housing and Household Characteristics in U.S. Residential Heat Risk

C. J. Gabbe, Gregory Pierce,
extreme heathousingthermal inequitysocial vulnerability
Copyright Logoccby-sa-4.0 • https://doi.org/10.32866/001c.116607
Findings
Gabbe, C. J., and Gregory Pierce. 2024. “The Roles of Housing and Household Characteristics in U.S. Residential Heat Risk.” Findings, April. https:/​/​doi.org/​10.32866/​001c.116607.
Save article as...▾
Download all (2)
  • Table 1. Trade-offs and negative health effects by housing type, tenure, race, ethnicity, and income (all U.S. households)
    Download
  • Supplemental Information
    Download

Sorry, something went wrong. Please try again.

If this problem reoccurs, please contact Scholastica Support

Error message:

undefined

View more stats

Abstract

This study uses data from the 2020 nationally-representative U.S. Residential Energy Consumption Survey (RECS) to analyze the under-explored relationship between housing type, household characteristics, and two novel heat health risk measures. We use a combination of descriptive analysis and logistic regression models. The results show that renters and residents of lower-cost housing types – multifamily and manufactured housing – are much more likely to keep their homes at unhealthy temperatures and require medical attention due to hot indoor temperatures. We also find stark disparities in heat risk for households with lower incomes, seniors, and Black, Native American, multiracial, and Hispanic households.

1. Questions

People in the United States spend nearly 90% of their time indoors, most commonly at home, and yet we know little about how heat health outcomes vary by housing type and tenure (Gabbe, Mallen, and Varni 2022; Klepeis et al. 2001). Indoor temperatures are affected by structure design, air conditioning access, and the ability to afford energy costs (Iverson et al. 2020; Ostro et al. 2010; Stone et al. 2021). People with low-incomes and people of color experience broad thermal inequities, but these have been largely studied at neighborhood scales and outside of the housing context (Jesdale, Morello-Frosch, and Cushing 2013; Mitchell and Chakraborty 2018; O’Neill, Zanobetti, and Schwartz 2005). We answer the question: How are housing and household characteristics associated with heat-related health risk?

2. Methods

We used the Residential Energy Consumption Survey (RECS), a nationwide household survey conducted by the U.S. Energy Information Administration (EIA). The Public Use Microdata for 2020 includes 18,496 respondents and provides a representative sample of U.S. occupied housing units (U.S. EIA 2020). The survey’s heat health-related questions measure the frequency that a home was kept at an unhealthy temperature and whether someone in the household needed medical attention because the home was too hot. Although we do not know if respondents’ unhealthy temperature reports refer to hot or cold, there is likely a large overlap given research about household energy insecurity.

We first summarized the two heat risk variables by housing type, tenure, race, ethnicity, and income using survey weights provided by the U.S. EIA (U.S. EIA 2020). We then specified two sets of logistic regression models with households as the unit of analysis. Our binary outcome variables were: (1) kept home at an unhealthy temperature; and (2) needed medical attention due to a hot home. Independent variables pertained to housing type, tenure, setting, other housing characteristics, and household characteristics. These categories and variables are listed in the left two columns of Table 2. Additional details about model variables are included in this paper’s Supplemental Information. Models 1 and 3 only include housing type and tenure variables and models 2 and 4 include all independent variables.

3. Findings

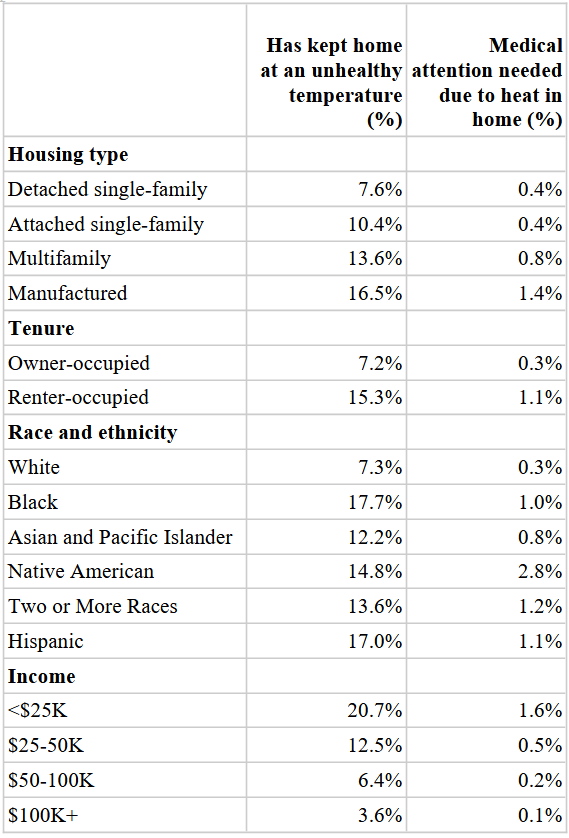
Households in manufactured and multifamily housing – and renter households in general – face the greatest health-related risks (Table 1). The differences are considerable when comparing manufactured housing and multifamily with detached single-family residences. Manufactured housing residents are more than twice as likely (16.5% vs. 7.6%) as detached single-family residents to keep their home at an unhealthy temperature and are nearly four times likelier to need medical attention due to heat in the home (1.4% vs. 0.4%). Renter-occupied households are more than twice as likely (15.3% vs. 7.2%) to keep their homes at an unhealthy temperature and more than three times likelier (1.1% vs. 0.3%) to need medical attention due to heat in the home.

Table 1
Table 1.Trade-offs and negative health effects by housing type, tenure, race, ethnicity, and income (all U.S. households)

Note: The white, Black, Asian and Pacific Islander, Native American, and two or more races variables are all calculated in terms of non-Hispanic householders.

Heat-related health disparities are much worse for Black, Native American, Hispanic, and multiracial households compared with white households, and to a lesser extent Asian and Pacific Islander, households. For example, Black, Native American, and Hispanic households are at least twice as likely to keep their homes at an unhealthy temperature relative to white households. The disparities are particularly pronounced in terms of seeking heat-related medical attention. Native American households are about nine times likelier (2.8% vs. 0.3%) and Hispanic households are more than three times likelier (1.1% vs. 0.3%) than white households to seek medical attention.

Low-income households also experience greater heat disparities. More than 20% of households with incomes below $25K keep their homes at an unhealthy temperature and 1.6% seek medical attention compared with 3.6% and 0.1% respectively of households with incomes of at least $100K.

The regression results indicate some disparities by housing type and tenure, even after controlling for household characteristics (Table 2). Manufactured housing residents are more likely to keep their homes at unhealthy temperatures (models 1 and 3) but these relationships are not statistically significant after controlling for other factors (models 2 and 4). Renters are positively associated with heat risk across all models, though the coefficients shrink after controlling for other factors.

Table 2.Logistic regressions on health variables (shown as odds ratios)
Kept home at unhealthy temperature Needed heat-related medical attention
(1) (2) (3) (4)
 
Housing type and tenure Attached sf (vs. detached) 1.116 (0.104) 1.098 (0.112) 0.459 (0.235) 0.460 (0.208)
Multifamily (vs. detached) 0.997 (0.083) 1.000 (0.095) 0.662 (0.211) 0.762 (0.235)
Manufactured housing (vs. detached) 2.304*** (0.225) 1.191 (0.131) 2.665** (0.946) 1.558 (0.519)
Renter-occupied 2.535*** (0.181) 1.266** (0.103) 4.955*** (1.396) 2.572*** (0.701)
Housing setting Cooling degree days (1000s) 1.046 (0.070) 1.034 (0.238)
Rural (vs. urban) 1.066 (0.086) 0.852 (0.262)
Other housing characteristics Built since 2000 0.985 (0.075) 1.508 (0.391)
Window or other AC (vs. central AC) 1.482*** (0.111) 1.157 (0.299)
No AC (vs. central AC) 1.730*** (0.152) 1.035 (0.332)
Any days without AC due to broken equipment 5.147*** (0.462) 9.149*** (2.055)
Adequate insulation 0.426*** (0.027) 0.421*** (0.092)
Has large shade tree 1.060 (0.062) 0.835 (0.178)
Household characteristics Black (vs. White) 1.790*** (0.164) 1.618 (0.509)
Asian and Pacific Islander (vs. White) 1.563*** (0.209) 2.248 (0.970)
Other race (vs. White) 1.439* (0.212) 4.115*** (1.502)
Hispanic (vs. White) 1.721*** (0.158) 1.792 (0.573)
Income below 50K 2.646*** (0.173) 2.705*** (0.688)
Household size 1.078* (0.035) 1.131 (0.119)
Number of children in household 0.915 (0.043) 1.059 (0.160)
Number of seniors in household 0.769*** (0.036) 1.406* (0.206)
 
Sample All HH All HH All HH All HH
Fixed Effects None State None State
Adjustments None None Bias reduction Bias reduction
McFadden's pseudo-R2 0.032 0.154 0.045 0.226
Observations 18,314 18,314 18,314 18,314
Log Likelihood -5,201.21 -4,546.04 -465.284 -377.089
Akaike Inf. Crit. 10,412.42 9,234.08 940.568 896.178

Notes: *p<0.05; **p<0.01; ***p<0.001; The white, Black, Asian and Pacific Islander, and Other Race variables are all calculated in terms of non-Hispanic householders.

Other housing characteristics are also associated with heat risk. Households with window AC or no AC are more likely to keep their home at an unhealthy temperature than households with central AC. Households that experienced broken AC equipment in the previous year are much more likely to have unhealthy home temperatures or need heat-related medical attention. Households that reported adequate insulation are less likely to have homes at unhealthy temperatures or need medical attention.

Households headed by a person of color and low-income households face greater heat risk. Black, Asian and Pacific Islander, other race (which includes Native American and multiracial households), and Hispanic households are all more likely to keep their homes at unhealthy temperatures. Households in the other race category are also more likely to need medical attention, while the three other race/ethnicity categories are not significantly different than white households. Households with incomes below $50K per year – roughly 200% of the poverty line for a family of four – are considerably more likely to keep their homes at an unhealthy temperature and need heat-related medical attention.

Two other household characteristics are positively connected with heat risk. Larger households are positively associated with unhealthy temperatures. In keeping with the literature, senior households are less likely to keep their home at an unhealthy temperature but need heat-related medical attention more often.

These findings underline the importance of identifying and mitigating disparities in thermal health. This study echoes previous research about thermal inequities by race, ethnicity, and economic status. Additionally, we show that unhealthy temperatures and heat-related medical attention are more prevalent for renters, even after controlling for race and income. Scholars have an opportunity to better understand the housing-related mechanisms related to heat health, and policy makers should target renters and manufactured housing residents for interventions.


Acknowledgements

This research was supported by a Santa Clara University Sustainability Research Grant. We thank the attendees of the 2022 Association of Collegiate Schools of Planning conference for their useful feedback.

Submitted: January 05, 2023 AEST

Accepted: August 28, 2023 AEST

References

Gabbe, C.J., E. Mallen, and A. Varni. 2022. “Housing and Urban Heat: Assessing Risk Disparities.” Housing Policy Debate 0 (0): 1–19. https:/​/​doi.org/​10.1080/​10511482.2022.2093938https:/​/​www.eia.gov/​consumption/​residential/​data/​2020/​.
Google Scholar
Iverson, Sally Ann, Aaron Gettel, Carla P. Bezold, Kate Goodin, Benita McKinney, Rebecca Sunenshine, and Vjollca Berisha. 2020. “Heat-Associated Mortality in a Hot Climate.” Public Health Reports 135 (5): 631–39. https:/​/​doi.org/​10.1177/​0033354920938006.
Google ScholarPubMed CentralPubMed
Jesdale, Bill M., Rachel Morello-Frosch, and Lara Cushing. 2013. “The Racial/Ethnic Distribution of Heat Risk–Related Land Cover in Relation to Residential Segregation.” Environmental Health Perspectives 121 (7): 811–17. https:/​/​doi.org/​10.1289/​ehp.1205919.
Google ScholarPubMed CentralPubMed
Klepeis, N. E., W. C. Nelson, W. R. Ott, J. P. Robinson, A. M. Tsang, P. Switzer, J. V. Behar, S. C. Hern, and W. H. Engelmann. 2001. “The National Human Activity Pattern Survey (NHAPS): A Resource for Assessing Exposure to Environmental Pollutants.” Journal of Exposure Science & Environmental Epidemiology 11 (3): 231–52. https:/​/​doi.org/​10.1038/​sj.jea.7500165.
Google Scholar
Mitchell, Bruce Coffyn, and Jayajit Chakraborty. 2018. “Exploring the Relationship between Residential Segregation and Thermal Inequity in 20 U.S. Cities.” Local Environment 23 (8): 796–813. https:/​/​doi.org/​10.1080/​13549839.2018.1474861.
Google Scholar
O’Neill, M. S., A. Zanobetti, and J. Schwartz. 2005. “Disparities by Race in Heat-Related Mortality in Four US Cities: The Role of Air Conditioning Prevalence.” Journal of Urban Health 82 (2): 191–97. https:/​/​doi.org/​10.1093/​jurban/​jti043.
Google ScholarPubMed CentralPubMed
Ostro, B., S. Rauch, R. Green, B. Malig, and R. Basu. 2010. “The Effects of Temperature and Use of Air Conditioning on Hospitalizations.” American Journal of Epidemiology 172 (9): 1053–61. https:/​/​doi.org/​10.1093/​aje/​kwq231.
Google Scholar
Stone, Brian, Evan Mallen, Mayuri Rajput, Ashley Broadbent, E. Scott Krayenhoff, Godfried Augenbroe, and Matei Georgescu. 2021. “Climate Change and Infrastructure Risk: Indoor Heat Exposure during a Concurrent Heat Wave and Blackout Event in Phoenix, Arizona.” Urban Climate 36 (March):100787. https:/​/​doi.org/​10.1016/​j.uclim.2021.100787.
Google Scholar
U.S. EIA. 2020. “2020 RECS Survey Data.” U.S. Department of Energy. https:/​/​www.eia.gov/​consumption/​residential/​data/​2020/​.

This website uses cookies

We use cookies to enhance your experience and support COUNTER Metrics for transparent reporting of readership statistics. Cookie data is not sold to third parties or used for marketing purposes.

Powered by Scholastica, the modern academic journal management system