Loading [Contrib]/a11y/accessibility-menu.js
Skip to main content
null
Findings
  • Menu
  • Articles
    • Energy Findings
    • Resilience Findings
    • Safety Findings
    • Transport Findings
    • Urban Findings
    • All
  • For Authors
  • Editorial Board
  • About
  • Blog
  • covid-19
  • search

RSS Feed

Enter the URL below into your favorite RSS reader.

http://localhost:21612/feed
Urban Findings
April 03, 2024 AEST

How much is US Office Building Space Reduced per Teleworker?

Kun Liu, Subhrajit Guhathakurta, Chaeyeon Han, Eric Hittinger, Sinoun Phoung, Eric Williams,
Office building spaceOffice workersTeleworkCOVID-19
Copyright Logoccby-sa-4.0 • https://doi.org/10.32866/001c.115400
Findings
Liu, Kun, Subhrajit Guhathakurta, Chaeyeon Han, Eric Hittinger, Sinoun Phoung, and Eric Williams. 2024. “How Much Is US Office Building Space Reduced per Teleworker?” Findings, April. https:/​/​doi.org/​10.32866/​001c.115400.
Save article as...▾
Download all (5)
  • Figure 1. Work flow of constructing dataset used in a regression model to determine office building space implications of telework. Given the lack of data on number of office workers, we construct a measure by using O*NET to assign occupations as office jobs or not, then use data from Occupational Employment and Wage Statistics on occupations per industry to find the office workers share per industry. This is combined with American Time Use data on the number of employees per industry to find the total number of office workers in a given year and region.
    Download
  • Figure 2. Office building space, number of office workers, and number of teleworkers for 9 census regions of the US from 2003 to 2019. Note that the office building space in New England and West North Central are close enough to make the lines difficult to distinguish.
    Download
  • Figure 3. Average office building space required by office workers and teleworkers for different time lags between change in employee status and change in office building space, see Equation (1). Avg. office building space required by office workers = \(\beta_{1}\), Avg. office building space required by teleworkers = (\(\beta_{1}\)+\(\beta_{2}\)). The p-value of \(\beta_{2}\) is shown, which is smallest for a time lag of 5 years.
    Download
  • Office building space, number of office workers, and number of teleworkers for 9 census regions of the US from 2003 to 2019
    Download
  • Manuscript File
    Download

Sorry, something went wrong. Please try again.

If this problem reoccurs, please contact Scholastica Support

Error message:

undefined

View more stats

Abstract

As office workers shift to telework, office building space requirements should decrease, but this relationship has not been empirically studied. We construct a dataset describing historical office building space, number of office workers, and number of teleworkers from 2003-2019 in the US, and use linear regression to estimate the effect of telework on office building space. The results show that the average office building space required for an additional office worker and teleworker is 32 and 18 square meters (340 and 191 square feet), respectively, suggesting an average 44% reduction in office building space when an office worker transitions to telework.

1. Questions

Teleworking presumably reduces the need for office building space, which in the US currently accounts for 17% of the commercial building floor space and 16% of commercial building energy use (EIA 2018). There has been a gradual long-term increase in teleworking (Phoung et al. 2024). A rapid surge in teleworking during COVID-19 (O’Brien and Aliabadi 2020) highlighted its significance for the economy in general and for energy demand in office, residential, and transportation sectors. Given the continued popularity of teleworking, one expects it will drive reduced demand for office building space in years to come. By quantifying the relationship between telework and office building space, we can anticipate changes in the real estate market and inform urban planning. There are implications for energy demand as well: teleworkers tend to use more energy at home and less in offices and transportation, but its effect on office building space is poorly understood (Phoung et al. 2024). These considerations motivate the driving question of this paper:

What effect has telework had on the area of office building space in the US?

2. Methods

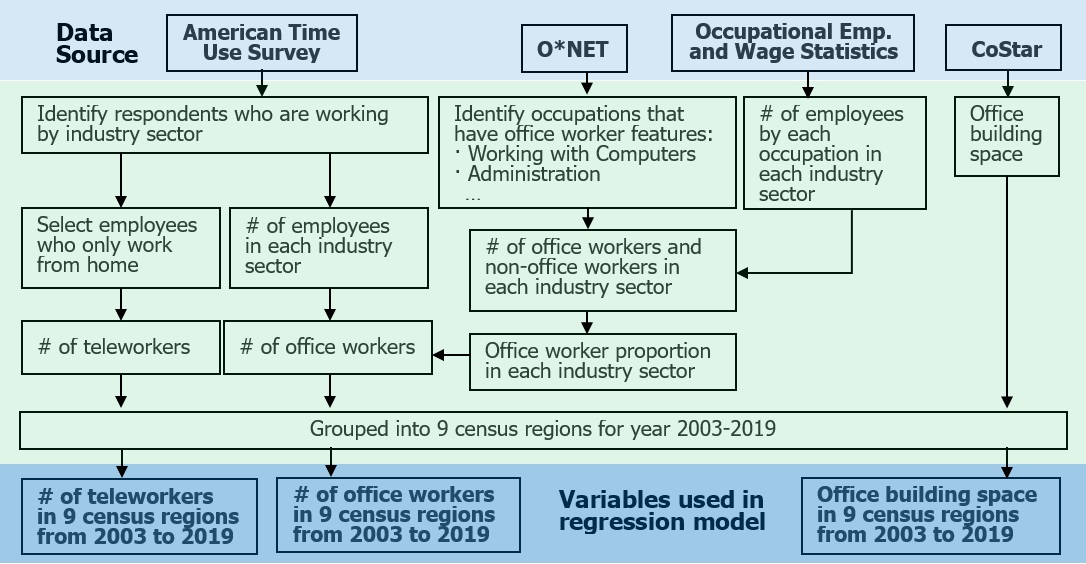
We address the research question by building a regression model to explain historical office building space based on the number of office workers and teleworkers. Historical office building space is available from the CoStar database (CoStar Group 2023). The number of office workers indicates total demand for offices and is estimated by combining our estimates of the share of office jobs based on O*NET (USDOL/ETA 2023) with data on the number of employees in Occupational Employment and Wage Statistics (OEWS) (BLS 2023b). Increases in the number of teleworkers, which is taken from the American Time Use Survey (ATUS) (BLS 2023a), drives down demand for office buildings. The number of (full-time) teleworkers is computed by identifying the respondents who work from home and then deleting the hybrid teleworkers who work both from home and at an office (Phoung et al. 2024). Figure 1 shows the logic connecting the data sources to processed variables for the regression model.

Figure 1
Figure 1.Work flow of constructing dataset used in a regression model to determine office building space implications of telework. Given the lack of data on number of office workers, we construct a measure by using O*NET to assign occupations as office jobs or not, then use data from Occupational Employment and Wage Statistics on occupations per industry to find the office workers share per industry. This is combined with American Time Use data on the number of employees per industry to find the total number of office workers in a given year and region.

The key challenge is how to construct variables for the regression model given data constraints. The CoStar database tracks historical office building space by location, but not by industry or occupation; i.e., we can differentiate across time and region, but not by industry or occupation. We need corresponding datasets for the number of office workers and teleworkers by year and region. The ATUS and OEWS provides annual data by region, year and for different industries and occupations. The number of office workers variable ought to describe the number of people working in an “office” (a room with desk and computer), whether in an office building or a home office. There is no direct data source describing this for the US, so we construct a dataset by first estimating the fraction of office jobs per industry sector. We use the O*NET database, which provides information on occupational characteristics and requirements nationwide (USDOL/ETA 2023). We identify office workers by screening the survey questionnaires in four O*NET occupational descriptors: Work Activities, Work Context, Skills, and Knowledge. This resulted in defining 30 office worker features that help to distinguish whether an occupation requires an office, such as “Working with Computers”, “Administration and Management”, and “Economics and Accounting” among others. Any occupation with more than 5 of these 30 features is defined as an office occupation. We then combine this list of office occupations with the OEWS dataset that estimates annual employment for about 830 detailed occupations in each major industry sector to produce the proportion of office workers (Table 1).

Table 1.The estimated proportion of office workers in each industry sector
Industry Sector Proportion of Office Workers (%)
Agriculture, Forestry, Fishing and Hunting 7.6
Mining, Quarrying, and Oil and Gas Extraction 24.7
Utilities 44.1
Construction 22.0
Wholesale Trade 46.7
Information 60.2
Finance and Insurance 79.5
Real Estate and Rental and Leasing 51.1
Professional, Scientific, and Technical Services 71.4
Management of Companies and Enterprises 71.8
Administrative and Support and Waste Management and Remediation Services 39.2
Educational Services 61.6
Health Care and Social Assistance 51.5
Arts, Entertainment, and Recreation 28.7
Accommodation and Food Services 7.4
Other Services (except Public Administration) 34.3
Public Administration 57.6
Manufacturing 26.9
Retail Trade 17.8
Transportation and Warehousing 15.8

Note: For each industry sector, the Proportion of Office Workers = Number of Office Workers/Number of Employees

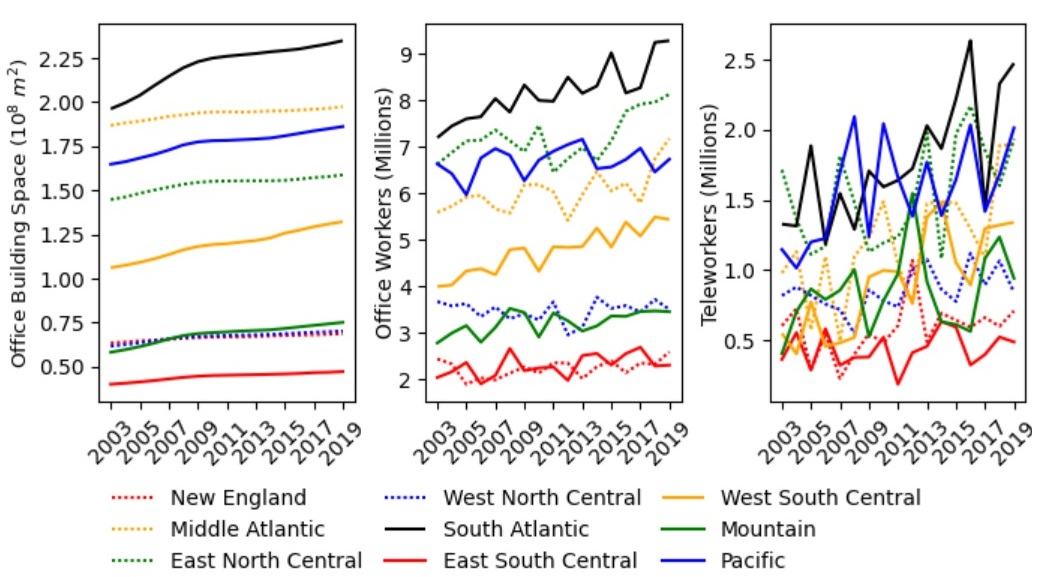
ATUS describes the employment per sector, combining this with Table 1 results yields the number of office workers per year and region. The result is a dataset for the three variables for 2003-2019 for 9 census regions (USCB 2013), generating 153 data points (Figure 2) for the regression model outlined in equation (1).

Figure 2
Figure 2.Office building space, number of office workers, and number of teleworkers for 9 census regions of the US from 2003 to 2019. Note that the office building space in New England and West North Central are close enough to make the lines difficult to distinguish.

Ordinary Least Squares regression (OLS) is applied to the following model:

\[\small{\begin{aligned}{Office\ Building\ Space}_{t + \Delta,\ \ r}\ (m^{2}) =& \beta_{0}(m^{2}) + \beta_{1}\left( \frac{m^{2}}{worker} \right) \\&\times {\#\ {of}\ {Office}\ Workers}_{t,r} \\ &+ \beta_{2}\left( \frac{m^{2}}{worker} \right) \\&\times {\#\ of\ Teleworkers}_{t,r} + \ \epsilon\end{aligned}\tag{1}}\]

\(\beta_{1}\) is the average office building space needed per additional office worker, and \(\beta_{2}\) is the average influence on office building space per teleworker. \(\beta_{2}\) is expected to be negative (telework should reduce office building space). The sum (\(\beta_{1}\)+\(\beta_{2}\)) can be interpreted as the “office building space required by teleworkers”. \(\epsilon\) is the error term.

t refers to a year between 2003 and 2019, and r denotes one of 9 census regions in the US. Owing to the fact that the average office lease spans about 3 to 5 years (Fisher and Ciochetti 2007) as well as other time-lagging effects, transitioning an office worker to a teleworker may not have an immediate reduction in office building space. Thus, we expect a delay between the change in number of office workers and teleworkers and the resulting change in office building space utilization. To account for this delay, the regression model includes the time lag Δ ranging from 0 to 6 years.

3. Findings

On average, each office worker requires 32 m2 (340 square feet) of office building space. If an office worker transitions to telework, the required office building space is reduced by an average of 14 m2 (149 square feet).

The regressions (Figure 3) consistently had an R2 value of 0.89 for all time lags. The model shows that the “average office building space required by office workers” (\(\beta_{1}\)) is highly significant (p-values < 10-38) with a value of 30 to 32 m2. The p-value of \(\beta_{2}\) is higher, and varies by time lag (.034-.89). We choose a preferred model with the lowest p-value of \(\beta_{2}\) (time lag is 5 years), which suggests that the average office building space required by office workers and teleworkers is 32 and 18 m2, respectively. This suggests that shifting an office worker to a teleworker result in an average 44% reduction in office building space (14 m2). While this is a notable reduction, it is much lower than a 100% reduction that might be naively assumed by teleworkers no longer using office building space. There is a need for teleworkers to retain some office building functions, directly for meeting spaces and flexible offices, and indirectly for supporting functions such as payroll, which involves workers in office building space.

Figure 3
Figure 3.Average office building space required by office workers and teleworkers for different time lags between change in employee status and change in office building space, see Equation (1). Avg. office building space required by office workers = \(\beta_{1}\), Avg. office building space required by teleworkers = (\(\beta_{1}\)+\(\beta_{2}\)). The p-value of \(\beta_{2}\) is shown, which is smallest for a time lag of 5 years.

Note: p-values for average office building space required by office workers are less than 10-38

Acknowledgments

This research was supported by the U.S. National Science Foundation Environmental Sustainability program, grant #2243099.

Submitted: February 09, 2024 AEST

Accepted: March 19, 2024 AEST

References

BLS. 2023a. “American Time Use Survey—ATUS 2003‐2021 Multi‐Year Microdata Files.” U.S. Bureau of Labor Statistics. https:/​/​www.bls.gov/​tus/​data/​datafiles-0321.htm.
———. 2023b. “May 2022 National Industry-Specific and by Ownership of Occupational Employment and Wage Statistics.” Bureau of Labor Statistics/Occupational Employment and Wage Statistics. https:/​/​www.bls.gov/​oes/​tables.htm.
CoStar Group. 2023. “CoStar Market and Submarket Reports and Analytic Data.” CoStar Group. https:/​/​product.costar.com/​Market/​#/​search/​map.
EIA. 2018. “Commercial Buildings Energy Consumption Survey.” U.S. Energy Information Administration. https:/​/​www.eia.gov/​consumption/​commercial/​pba/​office.php.
Fisher, L.M., and B.A. Ciochetti. 2007. “Determinants of the Terms and Performance of Office Leases.” Real Estate Research Institute. https:/​/​www.researchgate.net/​publication/​253264203_Determinants_of_the_Terms_and_Performance_of_Office_Leases.
Google Scholar
O’Brien, William, and Yazdani Fereshteh Aliabadi. 2020. “Does Telecommuting Save Energy? A Critical Review of Quantitative Studies and Their Research Methods.” Energy and Buildings 225 (15): 110298. https:/​/​doi.org/​10.1016/​j.enbuild.2020.110298.
Google ScholarPubMed CentralPubMed
Phoung, Sinoun, Eric Hittinger, Subhrajit Guhathakurta, and Eric Williams. 2024. “Forecasting Macro-Energy Demand Accounting for Time-Use and Telework.” Energy Strategy Reviews 51 (January):101264. https:/​/​doi.org/​10.1016/​j.esr.2023.101264.
Google Scholar
USCB. 2013. “Census Regions and Divisions of the United States.” United States Census Bureau. https:/​/​www2.census.gov/​geo/​pdfs/​maps-data/​maps/​reference/​us_regdiv.pdf.
USDOL/ETA. 2023. “O*NET 28.1 Database.” U.S. Department of Labor, Employment and Training Administration. https:/​/​www.onetcenter.org/​database.html#individual-files.

This website uses cookies

We use cookies to enhance your experience and support COUNTER Metrics for transparent reporting of readership statistics. Cookie data is not sold to third parties or used for marketing purposes.

Powered by Scholastica, the modern academic journal management system