Loading [Contrib]/a11y/accessibility-menu.js
Skip to main content
null
Findings
  • Menu
  • Articles
    • Energy Findings
    • Resilience Findings
    • Safety Findings
    • Transport Findings
    • Urban Findings
    • All
  • For Authors
  • Editorial Board
  • About
  • Blog
  • covid-19
  • search

RSS Feed

Enter the URL below into your favorite RSS reader.

http://localhost:3455/feed
Transport Findings
December 31, 2019 AEST

Sunday Drivers, or Too Fast and Too Furious?

Juan Francisco (Frank) Arellano, Kevin Fang,
behaviorshared mobilitytransportation planningmicromobilityregulatione-scootersnew mobilityactive transportation
Copyright Logoccby-nc-4.0 • https://doi.org/10.32866/001c.11210
Photo by 🇨🇭 Claudio Schwarz | @purzlbaum on Unsplash
Findings
Arellano, Juan Francisco (Frank), and Kevin Fang. 2019. “Sunday Drivers, or Too Fast and Too Furious?” Findings, December. https:/​/​doi.org/​10.32866/​001c.11210.
Save article as...▾
Download all (2)
  • Figure 1. Observation Locations
    Download
  • Figure 2. Distribution of Bicyclist and E-Scooter Riders Speeds on Street
    Download

Sorry, something went wrong. Please try again.

If this problem reoccurs, please contact Scholastica Support

Error message:

undefined

View more stats

Abstract

The recent influx of electric scooters (e-scooters) has left cities scrambling to answer how to best to regulate them. To help inform policymaking, we studied e-scooter riding behavior through observations of speed and rider distractions. Observations show e-scooter riders travel faster on streets and slower on sidewalks and slightly slower than cyclists on streets. Additionally, few e-scooter riders wear helmets, and some may be distracted by headphones but not by handling cellphones.

Research Question and Hypothesis

In this study, we were interested in how e-scooter users physically behave as they ride, and how that compares to other users. Currently, while policy makers are concerned about rider behavior and may make assumptions about their behavior, there is a lack of data describing the actual behavior of e-scooter riders. For our purposes, e-scooters are motorized versions of standing kick scooters, which are comprised of a long narrow platform, rolling on two wheels, with handlebars.

Safety has been a prominent concern in policy debates over e-scooters (Lazo 2018a; Holder 2019; Sikka et al. 2019). Thus, we were particularly interested in looking at rider behaviors that relate to safety such as speed, the use of helmets, and potential distracted riding.

We hypothesized that e-scooter riders may be similar to bicyclists and other low-speed devices. If observations reveal e-scooter behaviors are in-fact similar to other modes, it may point to similar policy measures for e-scooters as other devices.

Methodology

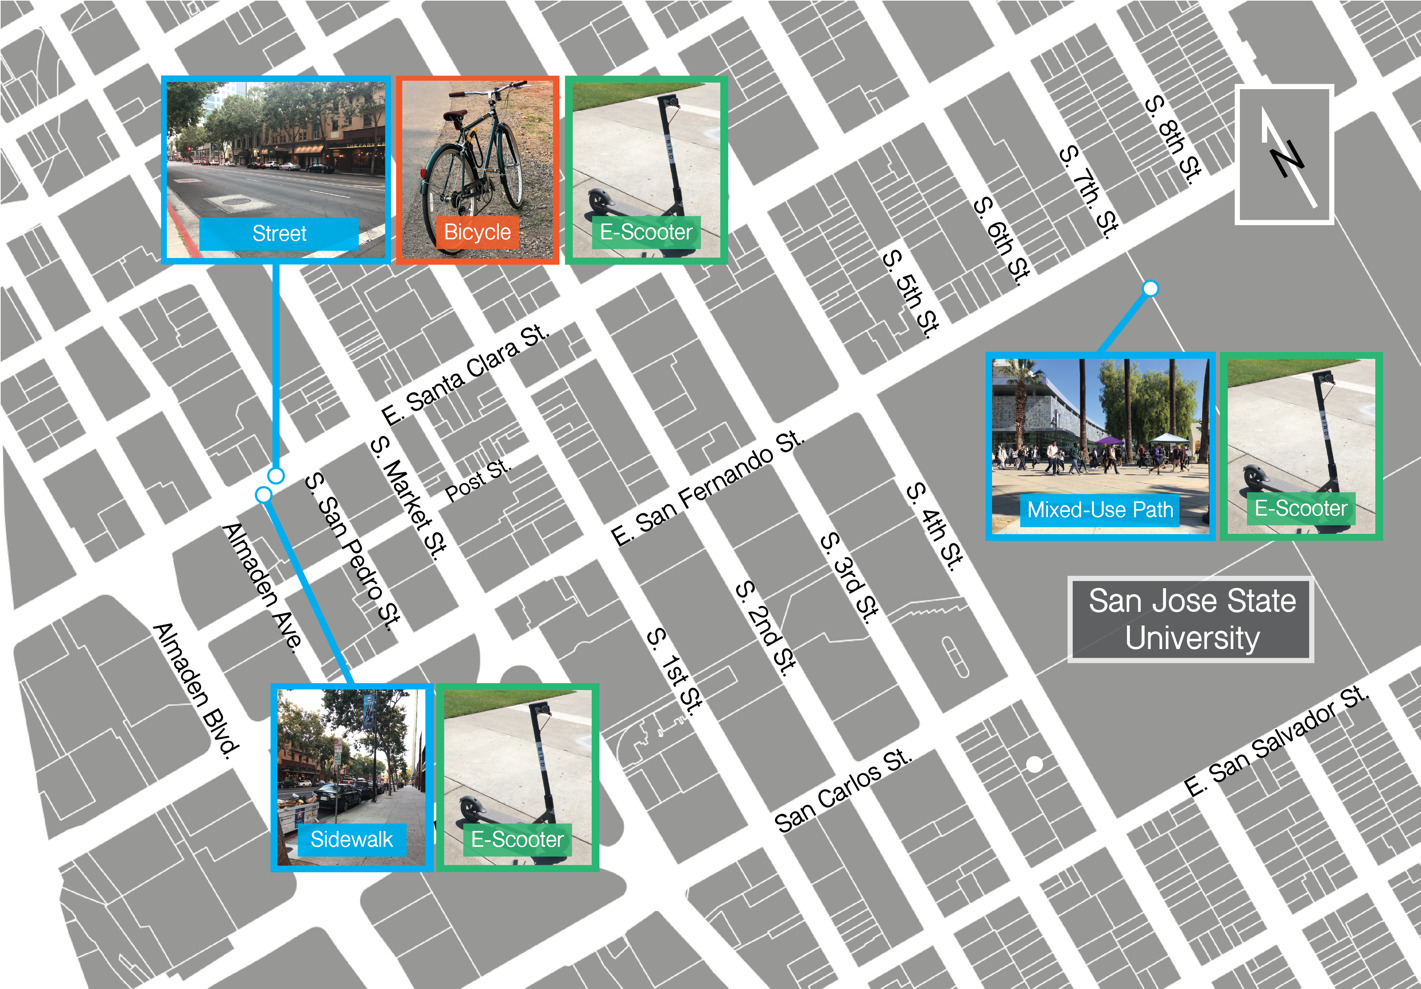
We observed 330 e-scooter riders in a case study area of downtown San Jose, California, United States, between October 2018 and February 2019. This included 110 observations each on streets, sidewalks, and a mixed-use path (pedestrians and cyclists allowed, no automobiles) (see Figure 1). For comparison, 110 observations of cyclists were observed on streets only. Sidewalk/street observations took place on Santa Clara Street, a main thoroughfare through downtown with prevalent e-scooter traffic. Mixed-use path observations occurred on a stretch of 7th Street through San Jose State University that is closed to vehicular traffic, a rare example of a mixed-use path in downtown.

Figure 1
Figure 1.Observation Locations

For speed, we measured the “space-mean speed” or the average speed as calculated through the measurement of the travel time for a rider to pass through an observation area of a known distance (Holdener et al. 1998). Our observation zones measured between 36.9 – 38.1 meters (m) [121 and 125 feet (ft)] in length delineated using natural checkpoints (e.g. poles, trees, pavement markings). Times were measured in real time using a smartphone stopwatch app. Similar methods were used by FHWA (2004), Birriel, Pernia, Lu, and Petritsch (2001), and Fang and Handy (2017), to measure speed of multiple mixed-use trail users, in-line skaters, and skateboarders, respectively. At the time of observation, e-scooter companies operating in San Jose were stating that their devices were limited to a maximum speed of 24.1 kph (15 mph) (Curry 2018; Lazo 2018b).

Additionally, we also recorded whether users wore helmets and whether riders engaged in a number of potential distracted behaviors, such as the use of cell phones and headphones.

Findings

Riders Travel Faster on Streets, Slower on Sidewalks, Between 6.4 and 24.1 kph

Rider speed varied by facility, with users traveling significantly slower when mixed with pedestrian traffic. Riders traveled on average 17.9 kilometers per hour (kph) [11.1 miles per hour (mph)] on streets, 14.5 kph (8.9 mph) on sidewalks, and 15.5 kph (9.6 mph) on mixed-use paths (see Table 1). In other words, riders traveled fastest on streets and slower on sidewalks and mixed-use paths. Furthermore, comparing the two pedestrian facilities, riders traveled faster on the wider mixed-use path versus the narrower sidewalks.

The lowest measured travel speed observed was 6.4 kph (4.0 mph), marginally faster than that of an adult walking (Knoblauch, Pietrucha, and Nitzburg 1996). The highest measured speed of 25.9 kph (16.1 mph) exceeded the advertised 24.1 kph (15 mph) maximum speed of these devices. This may indicate an apparent margin of error when attempting to govern device speeds or a potential error in our measurements, however our time measurements would need to be off by 5.3 seconds to result in an observation 1.8 kph above the stated cap. While the fastest riders were at (and slightly above) the stated maximum speed, the average speeds on the three facilities were 59, 64, and 74 percent of the maximum.

Table 1.Differences in E- Scooter Speeds Across All Facilities
Sidewalk
(n = 110)
Mixed-Use Path
(n = 110)
Street
(n = 110)
Average Speed 14.3 kph (8.9 mph) 15.5 kph (9.6 mph) 17.1 kph (11.1 mph)
Standard Deviation 3.1 kph (1.9 mph) 3.1 kph (2.7 mph) 2.6 kph (1.6 mph)
Minimum 6.9 kph (4.3 mph) 6.4 kph (4.0 mph) 11.1 kph (6.9 mph)
15th Percentile 11.3 kph (7.0 mph) 10.9 kph (6.8 mph) 16.1 kph (10.0 mph)
50th Percentile 15.3 kph (9.5 mph) 15.1 kph (9.4 mph) 18.8 kph (11.7 mph)
85th Percentile 18.3 kph (11.5 mph) 19.6 kph (12.2 mph) 20.8 kph (12.9 mph)
Maximum 20.4 kph (12.7 mph) 25.9 kph (16.1 mph) 25.9 kph (16.1mph)

*kilometers per hour (kph), miles per hour (mph)
Comparisons:
t-test (Street vs. Sidewalk): p = <0.01
t-test (Street vs. Mixed-Use Path): p = 0.04
t-test (Sidewalk vs. Mixed-Use Path): p = <0.01
t-test (Has Pedestrians [Sidewalk & Mixed-Use Path] vs. No Pedestrians [Street]): p = <0.01
ANOVA (Street vs. Sidewalk vs. Mixed-Use-Path): p = <0.01

Noland (2019) also explored e-scooters and speed in Louisville, Kentucky. In contrast to this study, Noland calculated “trip speed” based on the total length and total duration of a scooter trip, which presumably includes time stopped. Our observations only include riders in motion and thus reflects the “cruising speed” rather than the trip speed of riders.

Males Ride Faster, Vary Less By Facility

On all three facilities, male riders traveled faster than females. For both genders, riders were faster on streets than on mixed-use paths than on sidewalks. However, the variance by facility was more pronounced among female riders (see Table 2).

Of note, male riders were also faster than females in other similar modes of micromobility. Birriel et. al (2001), found that male in-line skaters were faster than females, while Fang and Handy (2017) found that male cyclists rode faster than females.

Table 2.Differences in Average Speed by Facility Type and Gender
Average Speeds by Location Female
(n = 79)
Male
(n = 251)
Sidewalk (n=110) 12.9 kph (8.0 mph) 15 kph (9.3 mph)
Mixed-use path (n=110) 14.6 kph (9.1 mph) 16 kph (9.9 mph)
Street (n=110) 18.2 kph (11.3 mph) 17.9 kph (11.1 mph)
Percent Decrease in Speed From… Female Male
Street → Mixed-Use Path 17% 11%
Street → Sidewalk 29% 23%
Percent Increase in Speed From… Female Male
Sidewalk → Mixed-Use Path 14% 6%
Mixed-Use Path → Street 24% 12%
Sidewalk → Street 41% 20%

*miles per hour (mph), kilometers per hour (kph)

E-Scooters Riders Travel Slightly Slower than Cyclists

Comparing e-scooters on streets with cyclists on the same facility, we found that e-scooter riders traveled significantly slower than cyclists, 17.9 kph on average versus 19.6 kph (11.1 mph versus 12.2 mph) respectively. Figure 2 shows a comparative histogram of e-scooters and bicyclists in our street observation zone.

Figure 2
Figure 2.Distribution of Bicyclist and E-Scooter Riders Speeds on Street

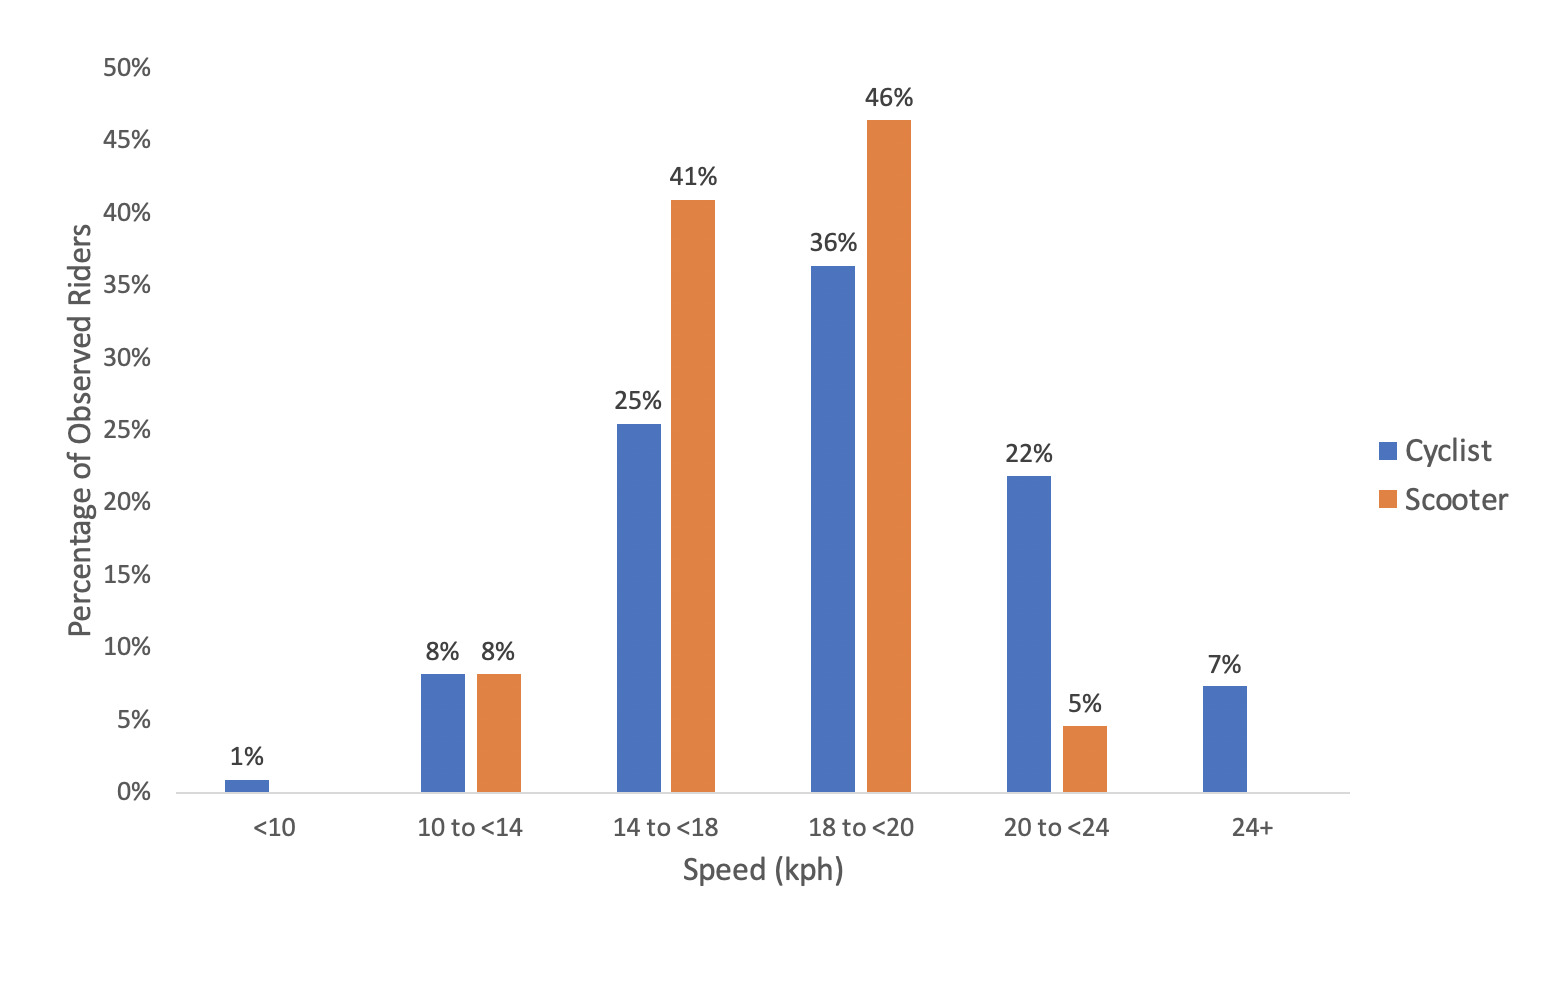
Table 3 shows the speed results from this study compared with other modes of transportation. Notably, the average e-scooter on a sidewalk is approximately 2.6 times faster than a younger adult pedestrian walking. Additionally, e-scooters observed here travel at similar speeds to other micromobility devices such as electric personal assist mobility devices (EPAMDs) [e.g. Segways], and human-powered skateboards.

Table 3.Speeds of Pedestrians, Cyclists, and other Micro-Mobility Devices
Mode/device N Average speed Range
(15th-85th Percentile)
Source
E-scooters
Sidewalks 110 14.3 kph (8.9 mph) 11.3 – 18.5 kph (7.0 – 11.5 mph) This study
Mixed-use paths 110 15.5 kph (9.6 mph) 10.9 – 19.6 kph (6.8 – 12.2 mph) This study
Streets 110 17.1 kph (11.1 mph) 16.1 – 20.8 kph (10 – 12.9 mph) This study
Bicycles
Streets 110 19.6 kph (12.2 mph) 15.4 – 24.3 kph (9.6 – 15.1 mph) This study
Mixed-use path 367 17 kph (10.6 mph) 11 kph - 22 kph (7.0 mph – 13.7 mph) FHWA, 2004
Mixed-use path 100 18.7 kph
(11.6 mph)
14.5 kph – 22.9 kph (9 mph – 14.2 mph) Fang and Handy, 2017
Electric bicycles
(Streets)
1,594 22 kph (13.6 mph) n/a Lin et al., 2008
Pedestrians,
walking
Younger (13-64) 3,458 5.4 kph (3.4 mph) 2.0 – n/a kph (1.25 – n/a mph) Knoblauch, Pietrucha, and Nitzburg, 1996
Older (65+) 3,671 4.5 kph (2.8 mph) 1.6 – n/a kph (0.97 – n/a mph) Knoblauch, Pietrucha, and Nitzburg, 1996
Pedestrians,
jogging
(young adults)
115 11.0 kph (6.8 mph) n/a Barreira, Rowe, and Kang, 2010
In-line skates
Mixed-use paths and streets 741 15.9 kph (9.9 mph) 11.5 – 20.3 kph (7.1 - 12.6 mph) Birriel, Pernia, Lu, and Petritsch, 2001
Mixed-use path 53 16 kph (9.9 mph) 12 – 23 kph (7.5 – 14.3 mph) FHWA, 2004
Kick scooters
(mixed-use path)
22 12 kph (7.5 mph) 9 - 15 kph (5.6 mph – 9.3 mph) FHWA, 2004
Skateboards
(mixed-use path)
100 15.6 kph
(9.7 mph )
12.9 – 18.3 kph
(8.0 - 11.4 mph)
Fang and Handy, 2017
EPAMDs
[e.g. Segways]
(mixed-use path)
4 15 kph (9.3 mph) 14 – 17 kph (8.7 mph – 10.6 mph) FHWA, 2004

Helmets Uncommon Among E-Scooter Riders

Only two percent of e-scooter riders observed wore helmets. All but one of those observed wearing a helmet was riding on the street, although even there, only 5.5 percent of riders wore helmets. Comparatively, 56.4 percent of bicyclists we observed on streets wore helmets. The difference in helmet use between e-scooter riders and bicyclists is an interesting question for future research. Potential factors might include differences in perceptions of safety by device or differences in behavior between users of shared devices (e-scooters) and private owners (bicyclists) in the observation area.

E-Scooter Riders are Less Distracted by Cell Phones, Found Using Headphones

Travelers being distracted by cell phones is often-cited as a problem for many modes of transportation, yet only one e-scooter rider was found holding a smartphone. Even then, the rider traveled slower than most [8.5 kph (5.3 mph)], a finding similar to that of bicyclists observed using cell phones (De Waard et al. 2010). Comparatively, De Waard, et al. (2010) found approximately 2.2 percent of bicyclists talking on their cell phones, while Fang and Handy (2017) found that four percent of skateboarders looked at a cell phone. Thus, e-scooter riders are apparently less distracted by cell phones compared to other modes. This may reflect that e-scooters, as currently designed, generally require two hands to operate and control.

Sixteen percent of riders were observed wearing headphones (possibly linked to music or a cell phone). Wolfe et. al. (2016) similarly found 17.7 percent of cyclists wore headphones while cycling.

Acknowledgements

The authors would like to acknowledge Rick Kos, AICP, and the San Jose State University Department of Urban and Regional Planning for their support and feedback over the course of this study.

References

Barreira, Tiago V., David A. Rowe, and Minsoo Kang. 2010. “Parameters of Walking and Jogging in Healthy Young Adults.” International Journal of Exercise Science 3 (1).
Google Scholar
Birriel, Elizabeth, Juan C. Pernia, Jian John Lu, and Theodore A. Petritsch. 2001. “Operational Characteristics of Inline Skaters.” Transportation Research Record: Journal of the Transportation Research Board 1773 (1): 47–55. https:/​/​doi.org/​10.3141/​1773-06.
Google Scholar
Curry, M. 2018. “CA Bill No Longer Redefines E-Scooters, But Removes Helmet Requirements for Over-18.” [Blog]. 2018. https:/​/​cal.streetsblog.org/​2018/​07/​03/​ca-bill-no-longer-redefines-e-scooters-but-removes-helmet-requirements-for-over-18/​.
De Waard, Dick, Paul Schepers, Wieke Ormel, and Karel Brookhuis. 2010. “Mobile Phone Use While Cycling: Incidence and Effects on Behaviour and Safety.” Ergonomics 53 (1): 30–42. https:/​/​doi.org/​10.1080/​00140130903381180.
Google Scholar
Fang, Kevin, and Susan Handy. 2017. “Skate and Die? The Safety Performance of Skateboard Travel: A Look at Injury Data, Fatality Data, and Rider Behavior.” Journal of Transport & Health 7 (December):288–97. https:/​/​doi.org/​10.1016/​j.jth.2017.08.010.
Google Scholar
FHWA. 2004. “Characteristics of Emerging Road and Trail Users and Their Safety.” Washington, D.C.: Federal Highway Administration Research and Technology. https:/​/​www.fhwa.dot.gov/​publications/​research/​safety/​04104/​.
Holdener, D., S. Turner, W. Eisele, and R. Benz. 1998. “Travel Time Collection Handbook.” Washington D.C: Federal Highway Administration. https:/​/​www.fhwa.dot.gov/​ohim/​tvtw/​natmec/​00020.pdf.
Holder, S. 2019. “Why Electric Scooters Companies Are Getting Serious About Safety.” [Blog]. City Lab. https:/​/​www.citylab.com/​transportation/​2019/​07/​scooter-crash-lime-bird-injuries-law-helmet-safety-advisory/​593920/​.
Knoblauch, Richard L., Martin T. Pietrucha, and Marsha Nitzburg. 1996. “Field Studies of Pedestrian Walking Speed and Start-Up Time.” Transportation Research Record: Journal of the Transportation Research Board 1538 (1): 27–38. https:/​/​doi.org/​10.1177/​0361198196153800104.
Google Scholar
Lazo, L. 2018a. “Dockless Bike, Scooter Firms Clash with U.S. Cities over Regulations.” The Washington Post, 2018. https:/​/​www.washingtonpost.com/​local/​trafficandcommuting/​dockless-bike-scooter-firms-clash-with-us-cities-over-regulations/​2018/​08/​04/​0db29bd0-9419-11e8-a679-b09212fb69c2_story.html.
———. 2018b. “Scooters: We Answer Your Questions about This Latest Transportation Trend.” The Washington Post. 2018. https:/​/​www.washingtonpost.com/​local/​trafficandcommuting/​scooters-we-answer-your-questions-about-this-latest-transportation-trend/​2018/​11/​10/​a94b7d94-de03-11e8-85df-7a6b4d25cfbb_story.html.
Lin, Sen, Min He, Yonglu Tan, and Mingwei He. 2008. “Comparison Study on Operating Speeds of Electric Bicycles and Bicycles.” Transportation Research Record: Journal of the Transportation Research Board 2048 (1): 52–59. https:/​/​doi.org/​10.3141/​2048-07.
Google Scholar
Noland, Robert B. 2019. “Trip Patterns and Revenue of Shared E-Scooters in Louisville, Kentucky.” Transport Findings, April. https:/​/​doi.org/​10.32866/​7747.
Google Scholar
Sikka, N., C. Vila, M. Stratton, M. Ghassemi, and A. Pourmand. 2019. “Sharing the Sidewalk: A Case of E-Scooter Related Pedestrian Injury.” The American Journal of Emergency Medicine 37 (9): 1807.e5-1807.e7. https:/​/​doi.org/​10.1016/​j.ajem.2019.06.017.
Google Scholar
Wolfe, Elizabeth Suzanne, Sandra Strack Arabian, Janis L. Breeze, and Matthew J. Salzler. 2016. “Distracted Biking.” Journal Of Trauma Nursing 23 (2): 65–70. https:/​/​doi.org/​10.1097/​jtn.0000000000000188.
Google ScholarPubMed CentralPubMed

This website uses cookies

We use cookies to enhance your experience and support COUNTER Metrics for transparent reporting of readership statistics. Cookie data is not sold to third parties or used for marketing purposes.

Powered by Scholastica, the modern academic journal management system