Loading [Contrib]/a11y/accessibility-menu.js
Skip to main content
null
Findings
  • Menu
  • Articles
    • Energy Findings
    • Resilience Findings
    • Safety Findings
    • Transport Findings
    • Urban Findings
    • All
  • For Authors
  • Editorial Board
  • About
  • Blog
  • covid-19
  • search

RSS Feed

Enter the URL below into your favorite RSS reader.

http://localhost:54963/feed
Transport Findings
November 07, 2019 AEST

A New Metric in Town: A Survey of Local Planners on California’s Switch from LOS to VMT

Jamey M. B. Volker, Joe Kaylor, Amy Lee,
development impact feesenvironmental impact analysistransportation impact analysislevel of servicevehicle miles traveled
Copyright Logoccby-nc-4.0 • https://doi.org/10.32866/10817
Photo by Derek Story on Unsplash
Findings
Volker, Jamey M. B., Joe Kaylor, and Amy Lee. 2019. “A New Metric in Town: A Survey of Local Planners on California’s Switch from LOS to VMT.” Findings, November. https:/​/​doi.org/​10.32866/​10817.
Save article as...▾
Download all (2)
  • Figure 1: Propriety of Switching from LOS to VMT for Environmental Reviews of Development Projects in Respondents’ Jurisdictions
    Download
  • Figure 2: Relative Cost of Analyzing Project-level VMT versus LOS
    Download

Sorry, something went wrong. Please try again.

If this problem reoccurs, please contact Scholastica Support

Error message:

undefined

View more stats

Abstract

This paper presents results from a 2018 survey of local planners (n = 77) about an impending transition in California’s environmental review law, which will require planners to evaluate land development projects for their effects on vehicle miles traveled (VMT) rather than automobile level-of-service (LOS). We find that most planners view VMT as an appropriate metric to measure environmental impacts from transportation, both generally and in their own jurisdictions. Outside of environmental review, some jurisdictions will likely continue to use LOS to assess development impact fees. But LOS may not be as ingrained in local planning practice as generally assumed.

1. RESEARCH QUESTIONS AND HYPOTHESES

Automobile level of service (LOS) has been the most commonly used metric of transportation system performance in the United States since it was introduced in the 1965 Highway Capacity Manual (DeRobertis et al. 2014; Dumbaugh, Tumlin, and Marshall 2014). But transportation and land use planning agencies are increasingly reconsidering how they use LOS (United States Department of Transportation 2017).

In December 2018, California effected an unparalleled transition. California’s Natural Resources Agency adopted regulations requiring that by July 1, 2020, local governments stop using LOS to measure the transportation impacts of land use developments under the state’s project-level environmental review law, the California Environmental Quality Act (CEQA) (California Natural Resources Agency 2019; Lee and Handy 2018; Volker, Lee, and Fitch 2019). Instead of LOS, agencies statewide must use a metric based on vehicle miles traveled (VMT).

Swapping LOS for VMT seems like a seismic philosophical, if not practical, shift in California planning. But will it be? To better understand the policy’s practical and philosophical implications, we surveyed the shepherds of the development process—land use and transportation planners for California’s cities and counties. This article explores three thematic questions using the survey results:

  1. Do local planners think LOS or VMT is the more appropriate metric to assess the transportation-related environmental impacts of land use developments?

  2. Outside of the environmental review process, to what extent do local governments currently use LOS and VMT metrics during the development approval process?

  3. Will local governments continue to use LOS outside of the environmental review process after the LOS-to-VMT switch for environmental review?

2. METHODS AND DATA

The data used for our exploratory analysis come from a survey we administered in the summer of 2018 to a sample of experienced planners from the planning and community development departments in California’s 481 cities and 58 counties (including San Francisco, which is both a county and a city). Table 1 lists verbatim the eight survey questions that informed our analysis of the three themes listed in the Research Questions and Hypotheses section.

Table 1:Survey Questions Analyzed for Each Theme
Theme Questionsa
(1) LOS and VMT as appropriate metrics in the environmental review context (1a) Do you view LOS as an appropriate metric to measure transportation-related impacts to the environment?b
(1b) Do you view VMT as an appropriate metric to measure transportation’s impacts to the environment?b
(1c) Do you personally think that switching transportation impact metrics from LOS to VMT for CEQA analyses is appropriate for your jurisdiction?
(1d) In your opinion, what is the largest burden associated with switching transportation impact metrics from LOS to VMT for CEQA analyses?
(1e) How much does analyzing project-level VMT cost versus analyzing project-level LOS in environmental review? Do not consider the cost of mitigating VMT or LOS impacts in choosing your answer.
(2) Metrics used outside the environmental review process (2a) Does your jurisdiction use project-level VMT estimates to assess transportation impact fees or other development fees for land use developments?
(2b) Does your jurisdiction use project-level LOS impact estimates to assess transportation impact fees or other development fees for land use developments?
(3) Use of LOS after the LOS-to-VMT switch (3) After it adopts VMT-based transportation impact significance thresholds pursuant to SB 743, does your jurisdiction plan to continue using LOS in its traffic impact analysis guidelines for assessing impacts and fees outside of CEQA for land use developments?

a SB 743, or Senate Bill 743 (2013), is the legislation that directed the Natural Resources Agency and the Governor’s Office of Planning and Research to develop an alternative to LOS for measuring transportation impacts in CEQA-required environmental reviews.

b The different phrasing regarding transportation-related impacts in questions 1a and 1b resulted from an accidental error when the survey was coded into the Qualtrics platform for online administration. Because the phrasing of both the question and answer choices are nonetheless nearly identical, we concluded that the responses to the two questions remain comparable.

Our recruitment pool comprised the directors or other experienced planners from planning departments in the 441 cities and 58 counties for which we were able to locate contact information using department websites and the state-compiled 2017 Directory of Planning Agencies (California Governor’s Office of Planning and Research 2018). We received 155 total responses. We then cleaned the data to remove duplicate responses and responses that did not answer any of the eight questions listed in Table 1. Our final sample size for this study is 77 (15.4% effective response rate). However, not every question listed in Table 1 garnered 77 responses because not every respondent answered all eight questions.

Table 2 breaks down respondents’ jurisdictions by type and population.

Table 2:Characteristics of Sampled Jurisdictions
Survey Sample All California
# Total Populationb Mean Pop. Median Pop. # Total Population Mean Pop. Median Pop.
Countiesa 10 2,383,917 238,392 40,993 58 7,475,336 128,885 66,607
Cities 67 5,164,394 77,080 36,541 481 32,265,172 67,079 30,931
Total 77 7,548,311 - - 539 39,740,508 - -

a The county numbers include San Francisco, which is both a county and a city. The county numbers exclude the populations of separately incorporated cities within the counties.

b All population numbers as of January 1, 2018, as estimated by the California Department of Finance (California Department of Finance, 2019). Less than 1% of the population in the 77 sampled jurisdictions lives in a rural area, defined as a county outside a metropolitan statistical area or a city outside an urbanized area or urban cluster. That compares to 13% statewide (Stanford Medicine, 2019).

The sample somewhat overrepresents planners from more populous and urban jurisdictions. The 67 cities are slightly more populous than both the average and median California city. The average population in the 10 sampled counties is also higher than the average population of all California counties, though the sampled counties have a lower median population. However, respondents from less-populous jurisdictions expressed their views more frequently in open-ended questions, and multiple respondents from urban areas raised concerns for rural areas.

3. FINDINGS

Philosophically, respondents were more likely to regard VMT as an “appropriate metric” of transportation-related environmental impacts than LOS. Nearly all respondents (95.9%) reported that VMT is either the “most appropriate metric” or “useful to measure some, but not all,” transportation-related impacts to the environment, compared to 83.6% for LOS. Only 4.1% of respondents replied that VMT is not an appropriate metric, while 16.4% found LOS inappropriate.

When asked about swapping LOS for VMT in environmental reviews of development projects in their own jurisdictions, 66.2% of the responding planners reported that they personally think the switch would be “appropriate” or “somewhat appropriate” (Figure 1). That includes two respondents whose jurisdictions were already using a VMT-based metric. It surprisingly also includes eight respondents who reported LOS as the “most appropriate metric” for transportation-related environmental impacts generally. But all eight also regarded VMT as useful to measure at least some impacts.

Figure 1
Figure 1:Propriety of Switching from LOS to VMT for Environmental Reviews of Development Projects in Respondents’ Jurisdictions

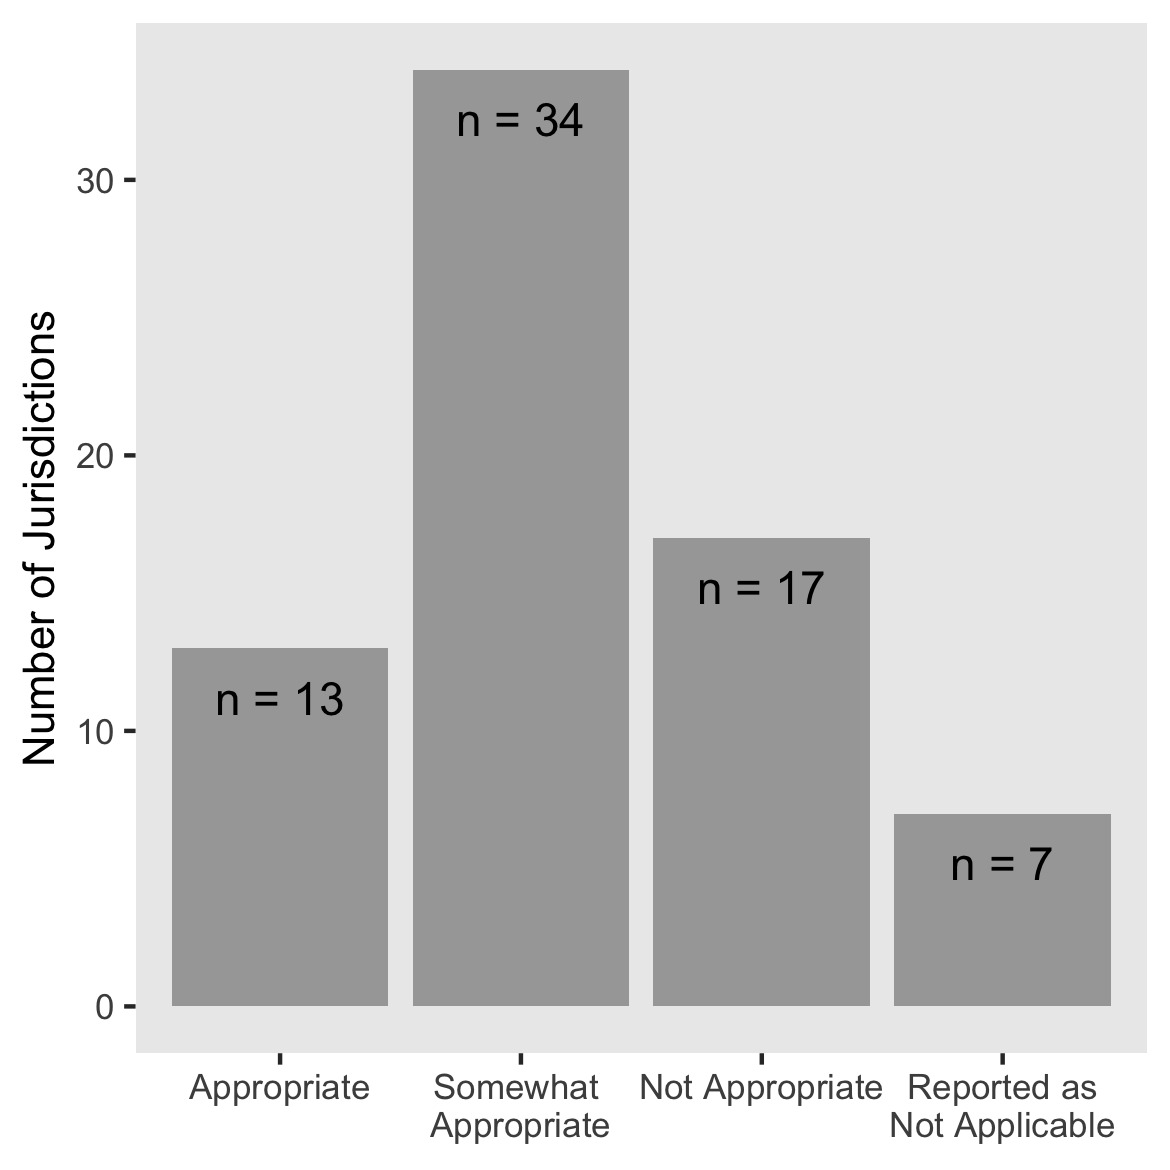
Only 23.9% of respondents replied that the LOS-to-VMT switch would not be appropriate in their jurisdiction (Figure 1). Why not? Those respondents’ answers to an open-ended question about the burdens of the switch (Table 1, question 1d) are telling. Of the 15 respondents who both answered the burden question and reported considering the LOS-to-VMT switch inappropriate, five (33.3%) opined that rural and suburban communities would be at a relative “disadvantage” with VMT as the impact metric. As one respondent put it: those areas “will always have higher VMT than urban areas,” meaning rural and suburban development could face greater scrutiny and VMT mitigation costs (depending on how regional the VMT baseline is against which project-level VMT significance is measured). Another two (13.3%) cited the continuing need to measure LOS to address congestion impacts. And four (26.7%) listed either a lack of resources, a lack of information on VMT metrics, or both, as the largest burden.

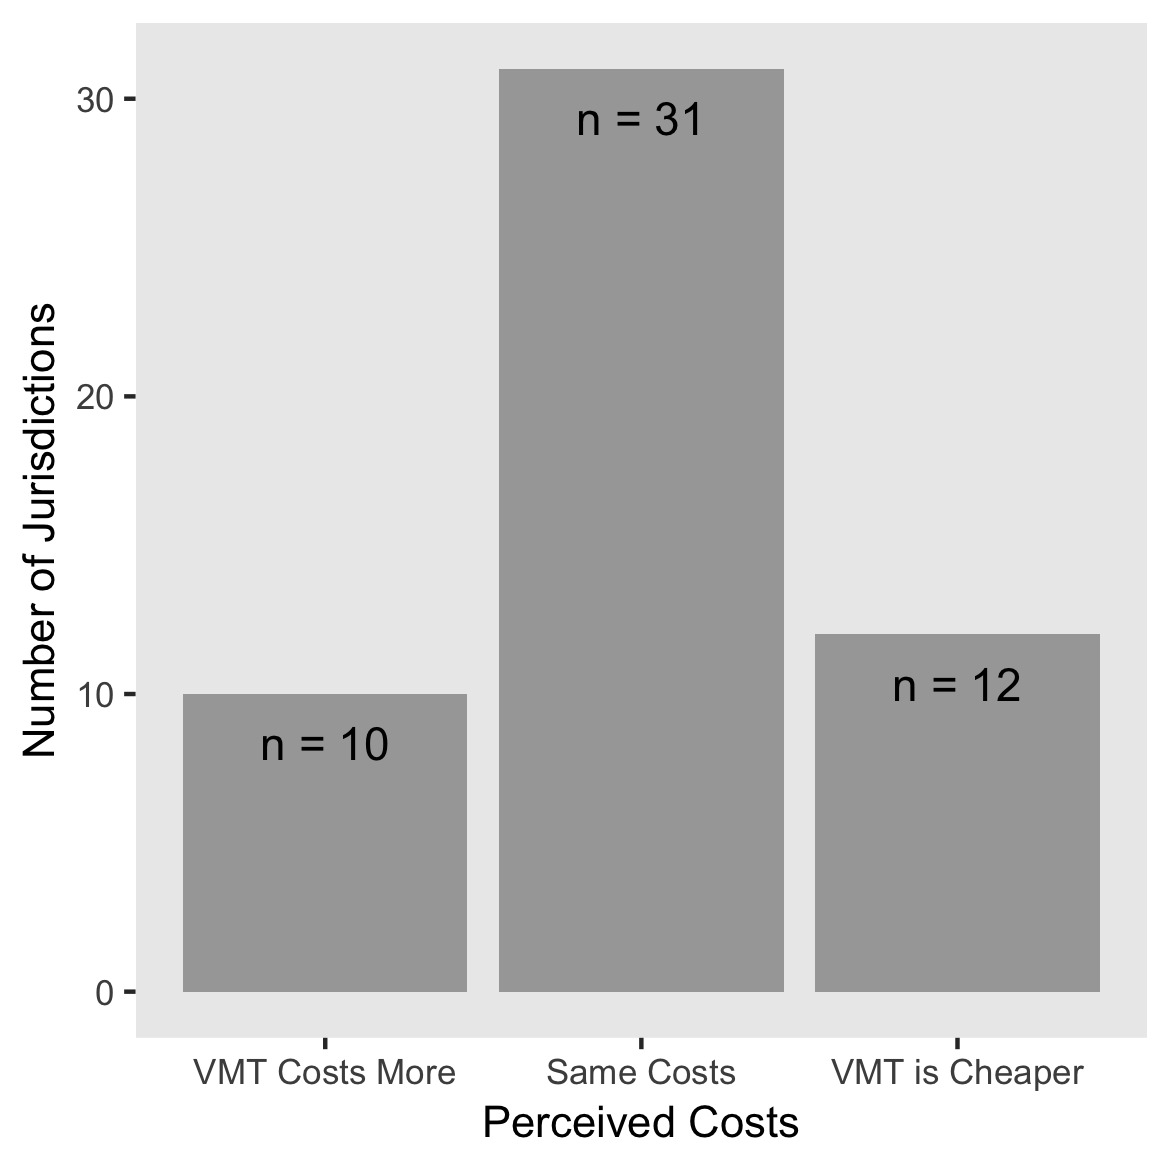
Overall, relative cost does not appear to be a major deterrent to swapping LOS for VMT in environmental reviews of land use projects. Most respondents (81.1%) reported that VMT analyses would not cost more than LOS analyses (Figure 2).

Figure 2
Figure 2:Relative Cost of Analyzing Project-level VMT versus LOS

What about local governments’ use of VMT and LOS metrics outside of the environmental review process? Table 3 shows that just 5.2% of respondents’ jurisdictions were using VMT to assess development impact fees for at least some new developments as of summer 2018. By contrast, 46.7% of jurisdictions were using project-level LOS when determining fees. That indicates some jurisdictions will likely continue to use LOS even after switching to VMT for environmental review (United States Department of Transportation 2017; Volker, Lee, and Fitch 2019). As one respondent opined: “VMT analysis doesn’t provide an accurate assessment of the development impacts to the transportation network. As such we will conduct VMT for purposes of CEQA but use LOS to identify real impacts to our circulation system.”

Table 3:Jurisdictions’ Current Use of VMT and LOS to Assess Development Impact Fees
Metric Yes, for all projects Yes, for some projects No, but we’re considering it Not Currently Other Totala
VMT Number 3 1 25 45 2 76
(%) 3.9% 1.3% 32.9% 59.2% 2.6% 100%
LOS Number 33 2 6 24 10 75
(%) 44.0% 2.7% 8.0% 32.0% 13.3% 100%

a Because not every respondent answered all survey questions, the denominator varies for each question.

But Table 3 also shows that 40% of jurisdictions were not using LOS to assess development impact fees outside of the environmental review process. That indicates LOS may not be as ingrained in local planning practice as generally assumed. Indeed, the survey results suggest jurisdictions’ reliance on LOS might erode further. Only 3 of 73 respondents indicated that their jurisdictions would “exclusively” use LOS in future assessments of “impacts and fees outside of CEQA for land use projects,” while two indicated their jurisdictions would exclusively use VMT. One quarter answered that their jurisdictions would use an LOS-VMT combination, and 67% said it “remains to be decided.”

References

California Department of Finance. 2019. “E-1 Population Estimates for Cities, Counties and the State with Annual Percent Change.” Sacramento, CA.
California Governor’s Office of Planning and Research. 2018. “2017 Directory of Planning Agencies.” http:/​/​opr.ca.gov/​docs/​20180614-2017_DOPA_final.pdf.
California Natural Resources Agency. 2019. “Amendments and Additions to the State CEQA Guidelines.” http:/​/​resources.ca.gov/​ceqa/​.
DeRobertis, M., J. Eeels, J. Kott, and R. Lee. 2014. “Changing the Paradigm of Traffic Impact Studies : How Typical Traffic Studies Inhibit Sustainable Transportation.” ITE Journal (Institute of Transportation Engineers) 84 (5): 30–35.
Google Scholar
Dumbaugh, E., J. Tumlin, and W.E. Marshall. 2014. “Decisions, Values, and Data: Understanding Bias in Transportation Performance Measures.” ITE Journal (Institute of Transportation Engineers) 84 (8): 20–25.
Google Scholar
Lee, Amy E., and Susan L. Handy. 2018. “Leaving Level-of-Service behind: The Implications of a Shift to VMT Impact Metrics.” Research in Transportation Business & Management 29 (December):14–25. https:/​/​doi.org/​10.1016/​j.rtbm.2018.02.003.
Google Scholar
Stanford Medicine. 2019. “Rural California: Demographics.” http:/​/​med.stanford.edu/​ruralhealth/​health-pros/​factsheets.html.
United States Department of Transportation. 2017. “Evolving Use of Level of Service Metrics in Transportation Analysis - Introduction.” https:/​/​www.transportation.gov/​office-policy/​transportation-policy/​evolving-use-level-service-metrics-transportation-analysis.
Volker, Jamey M. B., Amy E. Lee, and Dillon T. Fitch. 2019. “Streamlining the Development Approval Process in a Post-Level of Service Los Angeles.” Journal of the American Planning Association 85 (2): 114–32. https:/​/​doi.org/​10.1080/​01944363.2019.1601587.
Google Scholar

This website uses cookies

We use cookies to enhance your experience and support COUNTER Metrics for transparent reporting of readership statistics. Cookie data is not sold to third parties or used for marketing purposes.

Powered by Scholastica, the modern academic journal management system