Loading [Contrib]/a11y/accessibility-menu.js
Findings
  • Menu
  • Articles
    • Resilience Findings
    • Transport Findings
    • Urban Findings
    • All
  • For Authors
  • Editorial Board
  • About
  • Blog
  • search

    Sorry, something went wrong. Please try your search again.
    ×

    • Articles
    • Blog posts

RSS Feed

Enter the URL below into your favorite RSS reader.

https://findingspress.org/feed
×
Transport Findings
October 19, 2019 AEST

A Job, Indeed! Accessibility Equity to Advertised Employment in Cascadia

Jerome R Mayaud, Rohan Nuttall,
public transit equality inclusivity gini index machine learning smart cities job classifieds
Copyright Logoccby-nc-4.0 • https://doi.org/10.32866/10791
Photo by Sean Benesh on Unsplash
Findings
Mayaud, Jerome R, and Rohan Nuttall. 2019. “A Job, Indeed! Accessibility Equity to Advertised Employment in Cascadia.” Findings, October. https://doi.org/10.32866/10791.
Save article as...▾
  • PDF
  • XML
  • Citation (BibTeX)
Data Sets/Files (5)
Download all (5)
  • Table 1: Population and Transportation Statistics for the Study Cities
    Download
  • Figure 1 (a–c): Locations of Low- and High-Income Job Classifieds Extracted from Indeed.com; (d–f) Spatial Distribution of Income Across Each City, Derived by Grouping Self-Organizing Map (SOM) Clusters into Low and High Income Based on their Characteristic Distribution; (g–i) Spatial Distribution of Accessibility to Low–Wage Jobs; (j–l) Spatial Distribution of Accessibility to High–Wage Jobs. Accessibility is Calculated on the Basis of a Travel Time Threshold of 45 min Using Public Transit.
    Download
  • Figure 2: Lorenz Curves of Inequality, Showing Relationships Between Cumulative Proportion of Population and Cumulative Proportion of Accessibility to the Number of (a) Low-Wage Jobs, and (b) High-Wage Jobs. Cumulative Populations (Along the x-axis) are Ordered from Low to High Accessibility (in Terms of Number of Accessible Jobs) in Each Case. Grey 45o Line Represents the “Line of Equality.” Shaded Areas Are a Graphic Representation of the Social Exclusion Ratios for Each City (i.e., the Ratio of the Area Bounded by the Line of Equality, Lorenz Curve, and the Social Exclusion Threshold to the Area of the Triangle Bounded by the Line of Equality, the X-Axis and the Y-Axis), and These are also Represented in the Inset Bar Graphs. Social Exclusion is Defined as Having Access to <25% of Jobs, on the Basis of a Travel Time Threshold of 45 min by Public Transit.
    Download
  • Figure 3: Characteristics of Socially Excluded Residents, Disaggregated by Socioeconomic Group, for (a) Low-Wage Jobs and (b) High-Wage Jobs. Absolute Numbers Relating to Each Proportional Bar are also Shown (e.g., ~31% of Portland’s Unemployed Population is Socially Excluded from Low-Wage Jobs, Representing an Absolute Number of 3,903). Social Exclusion was Defined as Having Access to <25% of Jobs, on the Basis of a Travel Time Threshold of 45 min by Public Transit.
    Download
  • Supplementary Information
    Download

Sorry, something went wrong. Please try again.

If this problem reoccurs, please contact Scholastica Support

Error message:

undefined
×

View more stats

Abstract

We build on established inequality evaluation methods to assess (in)equities in accessibility to advertised jobs in Portland, Seattle, and Vancouver. We demonstrate the value of using postings from the world’s largest classifieds platform, Indeed.com, to complement existing employment datasets in accessibility studies.

RESEARCH QUESTIONS AND HYPOTHESIS

Many studies have analyzed access to actual jobs in a city using data from centralized employment repositories (Stokes and Seto 2018), or inferred them from commuter flows reported in censuses (e.g., Deboosere & El-Geneidy, 2018) and transport surveys (Allen and Farber 2019). However, few of these datasets explicitly link individual workers’ home origins with their employment destinations, which can limit conclusions about actual commuter dynamics (Pereira 2019). In contrast, few studies have performed accessibility analysis using job advertisements to which all residents can apply. Advertised jobs represent an alternative lens through which to view social mobility, complementing traditional job accessibility studies that focus more on the employment status quo. As the usage and reach of online job classifieds platforms dramatically increases, they are becoming a rich source of data for urban planners and economists.

The aim of this study is to demonstrate the value in using the world’s largest job classifieds website, Indeed.com, to evaluate access to economic opportunity across different socioeconomic groups in selected cities. We focus on the three largest cities in the Cascadia region—Portland, Seattle and Vancouver—because of their similar population sizes and transportation dynamics (Table 1).

Table 1:Population and Transportation Statistics for the Study Cities
Portland Seattle Vancouver
Total populationa 640,000 704,000 630,000
Population densitya (/km2) 1690 3,240 5,490
Geographic areaa (km2) 376 217 115
Mean commute time per day by public transitb (min) 90 74 77
Mean commute distance per journey by public transitb (km) 8.2 12.5 8
Mean walking distance per journeyb (km) 1 0.9 0.8
Median population-weighted household transportation spending, as a proportion of median household incomea (%) 11.8 10.4 10.2

Sources: aSimplyAnalytics (2018); bMoovit (2019)

METHODS AND DATA

Employment data were acquired from job classifieds posted on Indeed.com, a web platform representing one of the largest collections of unique job postings globally (Indeed 2019). We extracted all Indeed.com postings on a single weekday for each city (January 23, 2019 for Portland and Seattle, and January 12, 2019 for Vancouver). The volume and type of job advertisements can vary according to the time of year, so we acknowledge that some bias may be introduced in this particular case study. A further bias could be introduced by the fact that certain job types—specifically low-skilled and blue-collar work—are posted less frequently on the Indeed platform than are higher-skilled jobs. API restrictions prevented us from extracting the job postings on the same day for all three cities, but we expect no significant seasonal or weekly difference between them.

We extracted the latitude, longitude, and salary for each job posting using a combination of manual extraction and open-source geocoding services (see Supplementary Information). The total number of jobs extractable with full salary and geolocation information was 1,927 for Portland (35% of original sample), 1,040 for Seattle (19%) and 1,617 for Vancouver (30%). We used the median full-time hourly wage in each city (US$38,982 per annum [p.a.] in Portland, US$64,978 p.a. in Seattle, and C$50,070 p.a. in Vancouver), to categorize each parsed job posting as low-wage (below median wage) or high-wage (above median wage) (Figure 1a–c).

We obtained current-year sociodemographic estimates for 2018 at the smallest standard geographic unit for which all census data were available: the Census Block Group (CBG) level in the United States and the Dissemination Area (DA) level in Canada. The census data were spatially reorganized into a grid of equally sized hexagons (500 m diameter). We applied an unsupervised machine learning technique, the self-organizing map (SOM) (Kohonen 2001), to summarize the census income data into “low income” or “high income” categories (see Supplementary Information; (Mayaud, Anderson, et al. 2019)). The three cities show distinct spatial income distributions, with east–west divides in Portland and Vancouver and a north—south divide in Seattle (Figure 1d–f).

In order to capture the varying levels of job accessibility available to different social groups in the cities, we performed catchment area analysis using job locations and census data. We focused particularly on the potential labor force and the unemployed. Using OpenTripPlanner, we calculated travel time estimates between every “origin–destination” pair of grid cells, assuming travel by public transit (bus and rail, supplemented by walking) at 8 a.m. on a typical working day (Tuesday, 19 September, 2017). We then applied a cumulative opportunity measure (see Mayaud et al., 2018) to estimate the number of jobs accessible to the residents of each cell:

\[J_{o,T} = \sum_{d = 1}^{n}{J_{d}f\left( t_{\text{odr}} \right)}\]

\[f\left( t_{\text{odr}} \right) = \left\{ \begin{matrix} 1\ if\ t_{\text{odr}} \leq T \\ 0\ if\ t_{\text{odr}} > T \\ \end{matrix} \right.\ \]

Equation 1

where \(J_{o,T}\) is the number of jobs \(J\) that can be reached from origin \(o\) within time threshold \(T\), \(J_{d}\) is the number of jobs in destination cell \(d\), and \(f\left( t_{\text{odr}} \right)\) is a time threshold function the value of which (either zero or one) depends on whether travel time \(t_{\text{odr}}\) is greater or smaller than time threshold \(T\). We set \(T\) = 45 min, similar to travel time thresholds used by most employment-focused accessibility studies (Boisjoly and El-Geneidy 2017). Although there is a 14-month difference between the GTFS and jobs data, there were no major transit infrastructure changes affecting travel times around the three cities during this period.

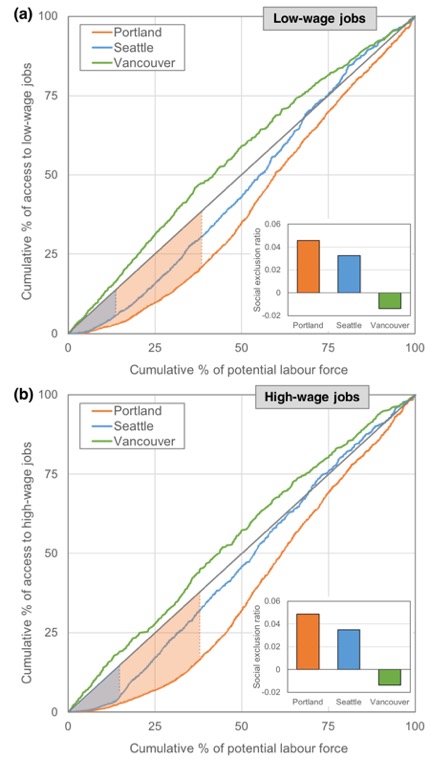
Finally, we applied a two-step Gini-based method (Lucas, van Wee, and Maat 2016; Mayaud, Tran, and Nuttall 2019) to examine the equity implications of job accessibility. First, we computed the Gini coefficient for each city’s job accessibility distribution to quantify inequality; this has been applied to other cities such as Melbourne, Australia (Delbosc and Currie 2011) and Toronto, Canada (Allen and Farber 2019). We then introduced a threshold value below which residents were deemed to be socially excluded from their city’s job market. Although defining a minimum level of job accessibility is a complex task, we defined social exclusion as accessing <25% of jobs within 45 min by public transit.

Figure 1
Figure 1

Figure prepared by authors using Google Maps as a basemap.

FINDINGS

Low- and high-wage jobs show similar spatial patterning within each city, owing to the concentration of jobs in downtown cores (Figure 1g–l). Accessibility is more evenly spread across Vancouver than Portland and Seattle, owing to Vancouver’s smaller area and greater densification.

Social exclusion to jobs (for the entire potential labor force) is displayed in Figure 2. Portland has the most classically unequal distribution, with the highest social exclusion to both low- and high-wage jobs, followed by Seattle. Vancouver has a negative social exclusion score, implying a far more socially equitable distribution of jobs.

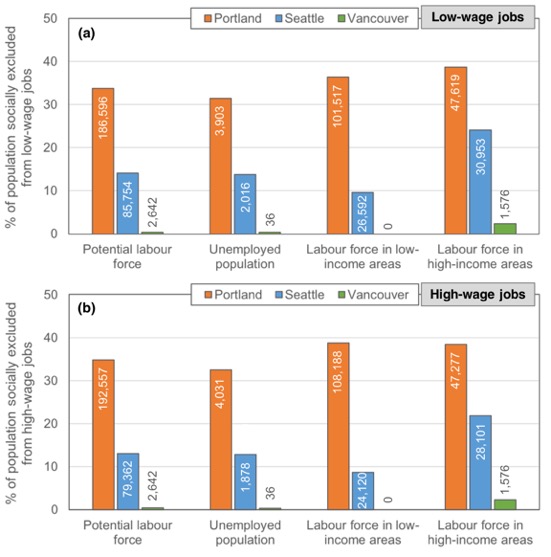
When social exclusion is dissected by socioeconomic grouping (Figure 3), we find that high proportions (>30%) of the potential labor force and unemployed people are socially excluded from low- and high-wage jobs in Portland. In absolute terms, over 70 times more people are socially excluded from jobs in Portland than in Vancouver.

Vancouver therefore appears to offer the best opportunity to access advertised job postings, and Portland the worst, across all sociodemographic strata investigated in this study. Portland’s high degree of social exclusion is particularly evident in low-income neighborhoods, where over 100,000 people cannot access a quarter of posted jobs (compared to ~25,000 in Seattle and 0 in Vancouver). This has potentially severe consequences for social mobility in certain parts of the city.

Figure 2
Figure 2:Lorenz Curves of Inequality, Showing Relationships Between Cumulative Proportion of Population and Cumulative Proportion of Accessibility to the Number of (a) Low-Wage Jobs, and (b) High-Wage Jobs. Cumulative Populations (Along the x-axis) are Ordered from Low to High Accessibility (in Terms of Number of Accessible Jobs) in Each Case. Grey 45o Line Represents the “Line of Equality.” Shaded Areas Are a Graphic Representation of the Social Exclusion Ratios for Each City (i.e., the Ratio of the Area Bounded by the Line of Equality, Lorenz Curve, and the Social Exclusion Threshold to the Area of the Triangle Bounded by the Line of Equality, the X-Axis and the Y-Axis), and These are also Represented in the Inset Bar Graphs. Social Exclusion is Defined as Having Access to <25% of Jobs, on the Basis of a Travel Time Threshold of 45 min by Public Transit.
Figure 3
Figure 3:Characteristics of Socially Excluded Residents, Disaggregated by Socioeconomic Group, for (a) Low-Wage Jobs and (b) High-Wage Jobs. Absolute Numbers Relating to Each Proportional Bar are also Shown (e.g., ~31% of Portland’s Unemployed Population is Socially Excluded from Low-Wage Jobs, Representing an Absolute Number of 3,903). Social Exclusion was Defined as Having Access to <25% of Jobs, on the Basis of a Travel Time Threshold of 45 min by Public Transit.

ACKNOWLEDGMENTS

We thank the Cascadia Urban Analytics Cooperative (CUAC) for partly funding this research. We are grateful to M. Tran, S. Anderson, V. Radic (University of British Columbia, Canada), and R. Pereira (Institute for Applied Economic Research, Brazil) for useful discussions about methodology and code.

References

Allen, Jeff, and Steven Farber. 2019. “Benchmarking Transport Equity in the Greater Toronto and Hamilton Area (GTHA).” Transport Findings, August. https://doi.org/10.32866/9934.
Google Scholar
Boisjoly, Geneviève, and Ahmed M. El-Geneidy. 2017. “How to Get There? A Critical Assessment of Accessibility Objectives and Indicators in Metropolitan Transportation Plans.” Transport Policy 55 (April): 38–50. https://doi.org/10.1016/j.tranpol.2016.12.011.
Google Scholar
Deboosere, Robbin, and Ahmed El-Geneidy. 2018. “Evaluating Equity and Accessibility to Jobs by Public Transport across Canada.” Journal of Transport Geography 73 (December): 54–63. https://doi.org/10.1016/j.jtrangeo.2018.10.006.
Google Scholar
Delbosc, Alexa, and Graham Currie. 2011. “Using Lorenz Curves to Assess Public Transport Equity.” Journal of Transport Geography 19 (6): 1252–59. https://doi.org/10.1016/j.jtrangeo.2011.02.008.
Google Scholar
Indeed. 2019. “About Indeed.” 2019. https://ca.indeed.com/about.
Kohonen, Teuvo. 2001. Self-Organizing Maps. 3rd ed. Berlin: Springer. https://doi.org/10.1007/978-3-642-56927-2.
Google Scholar
Lucas, Karen, Bert van Wee, and Kees Maat. 2016. “A Method to Evaluate Equitable Accessibility: Combining Ethical Theories and Accessibility-Based Approaches.” Transportation 43 (3): 473–90. https://doi.org/10.1007/s11116-015-9585-2.
Google Scholar
Mayaud, Jerome R., Sam Anderson, Martino Tran, and Valentina Radić. 2019. “Insights from Self-Organizing Maps for Predicting Accessibility Demand for Healthcare Infrastructure.” Urban Science 3 (1): 33. https://doi.org/10.3390/urbansci3010033.
Google Scholar
Mayaud, Jerome R., Martino Tran, and Rohan Nuttall. 2019. “An Urban Data Framework for Assessing Equity in Cities: Comparing Accessibility to Healthcare Facilities in Cascadia.” Computers, Environment and Urban Systems 78 (November): 101401. https://doi.org/10.1016/j.compenvurbsys.2019.101401.
Google Scholar
Mayaud, Jerome R., Martino Tran, Rafael H.M. Pereira, and Rohan Nuttall. 2019. “Future Access to Essential Services in a Growing Smart City: The Case of Surrey, British Columbia.” Computers, Environment and Urban Systems 73 (January): 1–15. https://doi.org/10.1016/j.compenvurbsys.2018.07.005.
Google Scholar
Pereira, Rafael H.M. 2019. “Future Accessibility Impacts of Transport Policy Scenarios: Equity and Sensitivity to Travel Time Thresholds for Bus Rapid Transit Expansion in Rio de Janeiro.” Journal of Transport Geography 74 (January): 321–32. https://doi.org/10.1016/j.jtrangeo.2018.12.005.
Google Scholar
Stokes, Eleanor C., and Karen C. Seto. 2018. “Tradeoffs in Environmental and Equity Gains from Job Accessibility.” Proceedings of the National Academy of Sciences 115 (42): E9773–81. https://doi.org/10.1073/pnas.1807563115.
Google ScholarPubMed CentralPubMed

Powered by Scholastica, the modern academic journal management system