Loading [MathJax]/jax/output/SVG/jax.js
Findings
  • Menu
  • Articles
    • Resilience Findings
    • Transport Findings
    • Urban Findings
    • All
  • For Authors
  • Editorial Board
  • About
  • Blog
  • search

    Sorry, something went wrong. Please try your search again.
    ×

    • Articles
    • Blog posts

RSS Feed

Enter the URL below into your favorite RSS reader.

https://findingspress.org/feed
×
Transport Findings
October 25, 2019 AEST

Diminishing Returns to Density and Public Transit

Murtaza Haider,
mode split public transit ridership transit planning diminishing returns population density
Copyright Logoccby-nc-4.0 • https://doi.org/10.32866/10679
Photo by Aditya Chinchure on Unsplash
Findings
Haider, Murtaza. 2019. “Diminishing Returns to Density and Public Transit.” Findings, October. https://doi.org/10.32866/10679.
Save article as...▾
  • PDF
  • XML
  • Citation (BibTeX)
Data Sets/Files (11)
Download all (11)
  • Table 1: Descriptive Statistics
    Download
  • Table 2: Piecewise Regression Models of Transit Mode Split
    Download
  • Figure 1A: Charting the Relationship between Population Density and Transit Mode Split
    Download
  • Figure 1B: Charting the Relationship between Population Density and Transit Mode Split
    Download
  • Figure 1C: Vancouver – Charting the Relationship between Population Density and Transit Mode Split
    Download
  • Table 3: Estimates of Transit + Walk + Bike Modes for Work Trips
    Download
  • Figure 2A: Charting the Relationship between Population Density and Transit + Walk + Bike Mode Split in the Three Metropolitan Areas
    Download
  • Figure 2B: Charting the Relationship between Population Density and Transit + Walk + Bike Mode Split in the Three Metropolitan Areas
    Download
  • Figure 2C: Charting the Relationship between Population Density and Transit + Walk + Bike Mode Split in the Three Metropolitan Areas
    Download
  • Figure 3A: Transit Mode Split and Proximity to Subway Stations and Downtown in Toronto
    Download
  • Figure 3B: Transit Mode Split and Proximity to Subway Stations and Downtown in Toronto
    Download

Sorry, something went wrong. Please try again.

If this problem reoccurs, please contact Scholastica Support

Error message:

undefined
×

View more stats

Abstract

This article uses piecewise regression to explore diminishing returns to population density and identifies the density thresholds in the three most populous Canadian metropolitan areas beyond which any increase in population density is associated with declining marginal returns in transit mode split. An improved understanding of diminishing returns will enable planners and transit operators to focus on specific transit modes and service areas where increasing population densities are more likely to correlate with higher transit mode splits.

1. RESEARCH QUESTION AND HYPOTHESIS

Previous research has found a strong positive correlation between transit mode split and population density. From cross-sectional studies (Newman and Kenworthy 1991) to localized analyses of travel mode choice, studies have consistently found “higher transit use with increasing density” (Polzin, Chu, and Rey 2000). And whereas higher population or employment densities may not be enough on their own to cause higher transit mode split, they are
considered enabling determinants of transit mode split along with other built-form proxies (Cervero and Kockelman 1997; Chakraborty and Mishra 2013). The very premise that built environment influences travel behavior carries a questionable “implicit conception of causality” (Næss 2015). Other critical reviews of density suggest that it “explains only a small fraction of the variation” in travel behavior (Ewing et al. 2018). Furthermore, an improvement in the quality or quantity of public transit (e.g., extending higher-order transit to suburbs) can improve the desirability of nearby parcels, contributing to accelerated land development and a subsequent increase in density (Cervero and Kang 2011).

In Toronto, an urban region with almost six million inhabitants (Statistics Canada 2017), development guidelines stipulate minimum thresholds for population densities to “make efficient use of land and infrastructure and support transit viability” (Government of Ontario 2017). Similar policy prescriptions are found in jurisdictions across the developed world.

Population density, as an input, could be subject to diminishing marginal returns. Mankiw (2014) defines diminishing returns as “the property whereby the benefit from an extra unit of an input declines as the quantity of the input increases.” This study investigates the specific thresholds beyond which an increase in population density is correlated with a lower marginal increase in transit mode splits.

2. METHODS AND DATA

This study used 2016 Census data for the three most populous census metropolitan areas in Canada, namely Toronto (5.93 million), Montreal (4.09 million), and Vancouver (2.46 million). The core municipality and the neighboring suburbs form a census metropolitan area (Statistics Canada 2012b). Population density and public transit mode split for work trips were analyzed at the census tract (CT) level, which approximates a neighborhood with a population between 2,500 and 8,000 (Statistics Canada 2012a). Descriptive statistics are presented in Table 1.

The geographic size of CTs varies considerably, from vast suburban CTs spanning several square kilometers in size to tiny tracts in the urban core. This results in some tracts reporting artificially very high population densities, which is partially due to the arbitrary spatial aggregation, also known as the modifiable areal unit problem (Zhang and Kukadia 2005). This article, therefore, computes average densities such that, for each CT, the reported population density is the average density of CTs whose centroids fall within a 1 km radius.

The study applied piecewise (segmented) regression to determine the “knot” or the breakpoint where the relationship between density and transit mode split transforms (Mitchell 2012). The nonlinear model simultaneously estimates the breakpoint and the slopes around it.

If y is the transit mode split (share of work trips made by public transit), d is the population density, and k is the knot, the nonlinear regression model is presented in the following equation:

y=(α+ β1d)∗(dd < k )+(α+β1k+β2∗(d−k))∗(dd ≥ k )
Equation 1

If the estimate for slope at densities beyond the breakpoint (β2) is less than the slope before the breakpoint (β1), it is taken as evidence in support of diminishing returns to density.

3. FINDINGS

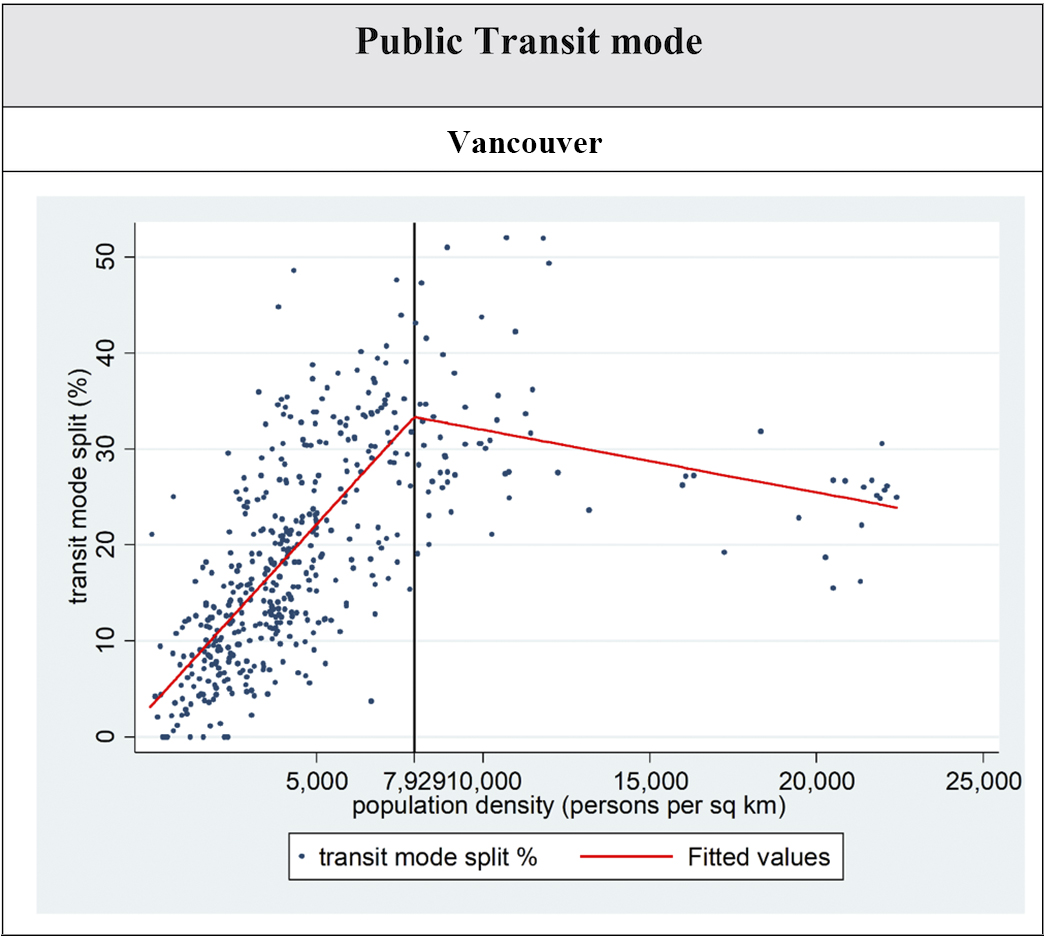
Using average population density as a regressor, the piecewise regressions estimated breakpoints at 7,763, 8,475, and 7,929 persons per square kilometer for Toronto, Montreal, and Vancouver, respectively (Table 2). The estimated slopes (β2s) beyond the breakpoints (knot) are smaller in magnitude than the slopes before the knots (β1s), supporting the argument that the strength of the association between population density and transit mode split weakens after the breakpoint and hence the diminishing returns to density. The negative coefficients for β2s for Montreal (statistically insignificant) and Vancouver (statistically significant) suggest that at very high densities a shift from public transit to nonmotorized modes is likely.

Table 1:Descriptive Statistics
Toronto Obs. Mean Std. Dev. Min Max
Transit mode split, work trips (%) 1,146 25.3 14.1 0.0 68.2
Transit + walk + bike trips (%) 1,146 31.7 19.3 0.0 89.1
Pop density (persons per km2) 1,151 5,564 6,428 0 82,434
Average pop density (persons per km2) 1,151 5,975 4,457 20 30,527
           
Montreal Obs. Mean Std. Dev. Min Max
Transit mode split, work trips (%) 951 25.0 15.2 0.6 66.0
Transit + walk + bike trips (%) 951 34.3 22.1 1.3 94.3
Pop density (persons per km2) 970 5,526 5,196 0 50,278
Average pop density (persons per km2) 970 5,783 4,005 20 14,915
           
Vancouver Obs. Mean Std. Dev. Min Max
Transit mode split, work trips (%) 472 19.4 10.8 0.0 52.0
Transit + walk + bike trips (%) 472 28.0 16.7 0.0 78.3
Pop density (persons per km2) 478 4,604 4,928 0 39,491
Average pop density (persons per km2) 478 5,027 4,047 15 22,406
Table 2:Piecewise Regression Models of Transit Mode Split
Transit % Toronto
Variables Coefficients
Density ≤ 7,763 (β1) 0.00481***
Density > 7,763 (β2) 0.00015
Constant 1.40605
Observations 1,146
Adjusted R2 0.54
   
  Montreal
Variables Coefficients
Density ≤ 8,475 (β1) 0.00461***
Density > 8,475 (β2) −0.00007
Constant 2.03336***
Observations 951
Adjusted R2 0.74
   
  Vancouver
Variables Coefficients
Density ≤ 7,929 (β1) 0.00382***
Density > 7,929 (β2) −0.00065***
Constant 3.05498***
Observations 472
Adjusted R2 0.53

*p < .05; **p < .01; ***p < .001.

Figure 1A
Figure 1A:Charting the Relationship between Population Density and Transit Mode Split
Figure 1B
Figure 1B:Charting the Relationship between Population Density and Transit Mode Split
Figure 1C
Figure 1C:Vancouver – Charting the Relationship between Population Density and Transit Mode Split

The scatter plots in Figures 1A-C illustrate how the relationship between population density and transit mode split (illustrated with red regression lines) changes beyond the breakpoints, which are represented as black vertical lines with each dot representing a CT. At breakpoints, any further increase in density may not result in higher public transit mode share, although one may still observe an increase in public transit ridership.

Very high population densities in the three cities occur in and near downtowns, which are also major employment hubs resulting in both high population and employment densities. Because of mixed land uses, residents of very high-density neighborhoods could walk or bike to work, as they benefit from shorter commutes. According to the 2016 Census, more than 90 percent of walk commutes between 8:00 and 8:59 a.m. in the three cities were less than 3 km long. One in two walking trips stretched for less than 1 km.

This study tested the assumption that higher population densities in the three cities are characterized by mixed land uses. Thus, at higher densities, one would see an increase in the share of trips made by walking and biking.

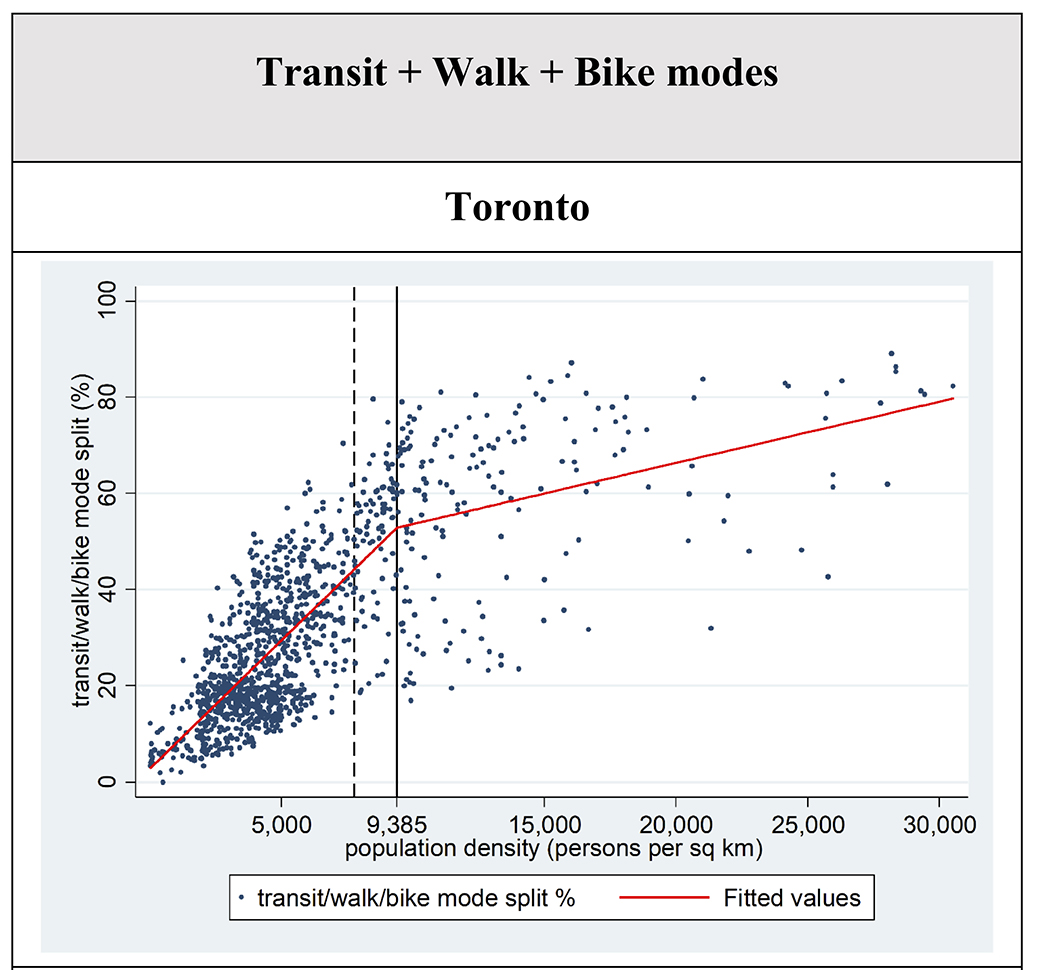
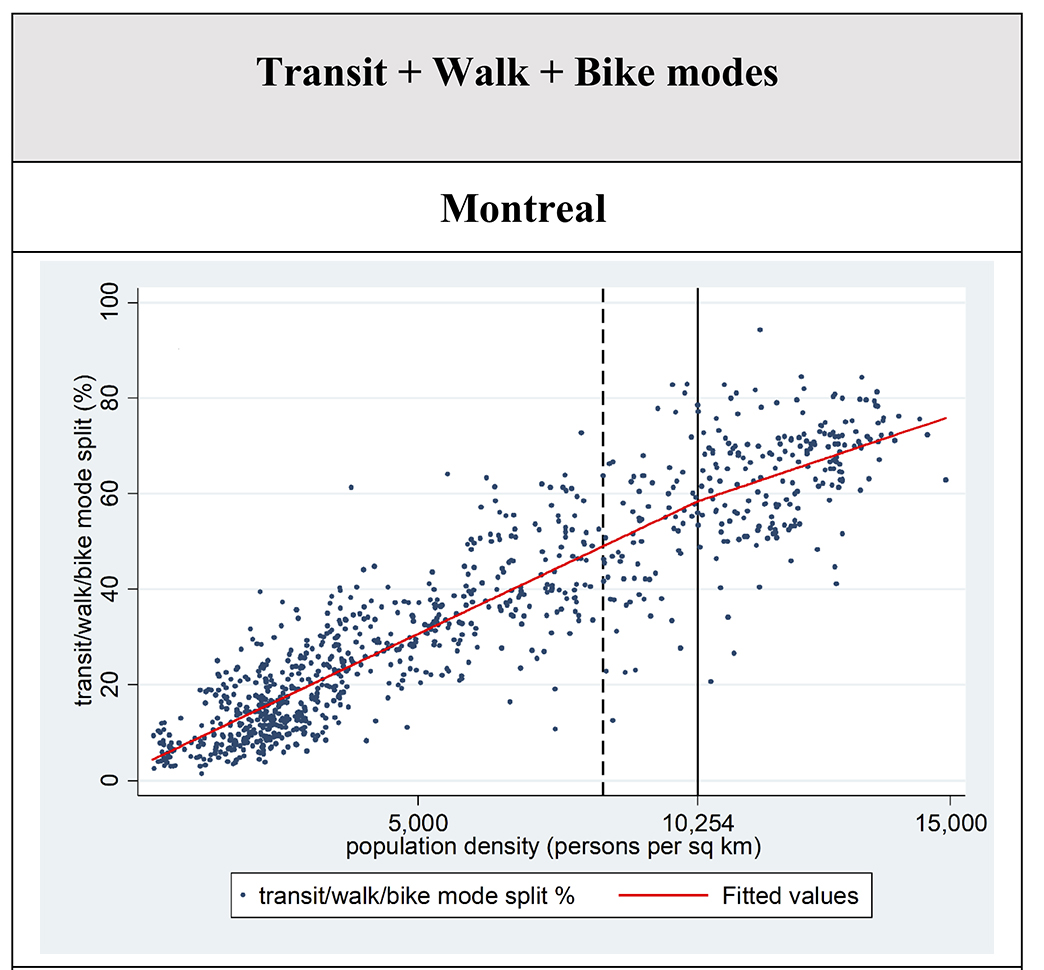
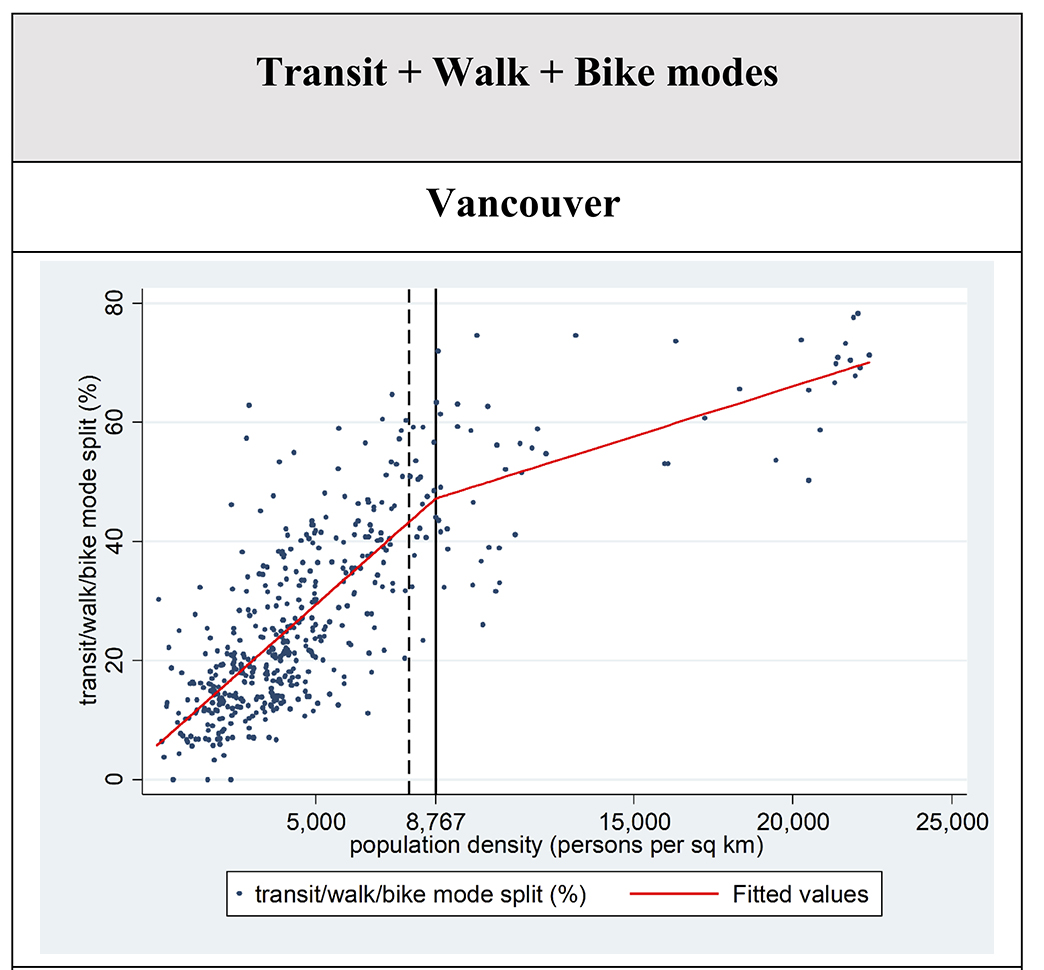
The models reported in Table 3 regress the total share of trips by walking, biking, and transit (the sustainable modes) over average population densities. When the three modes are aggregated, the density breakpoints occur at higher densities. In Toronto, for instance, the breakpoint for sustainable mode share increases to 9,385 persons/km2 from the 7,763 estimated earlier for transit mode share. This is illustrated in Figures 2A-C, where the new breakpoints are represented by solid vertical lines and those for transit mode split are represented by dashed vertical lines.

Interestingly, diminishing returns also hold for sustainable modes where the coefficients for slope after the breakpoint are smaller than those before the breakpoint, which we take as evidence for diminishing returns. The differences between respective slopes (β1−β2) for the models reported in Tables 1 and 2 are statistically significant at p<.05.

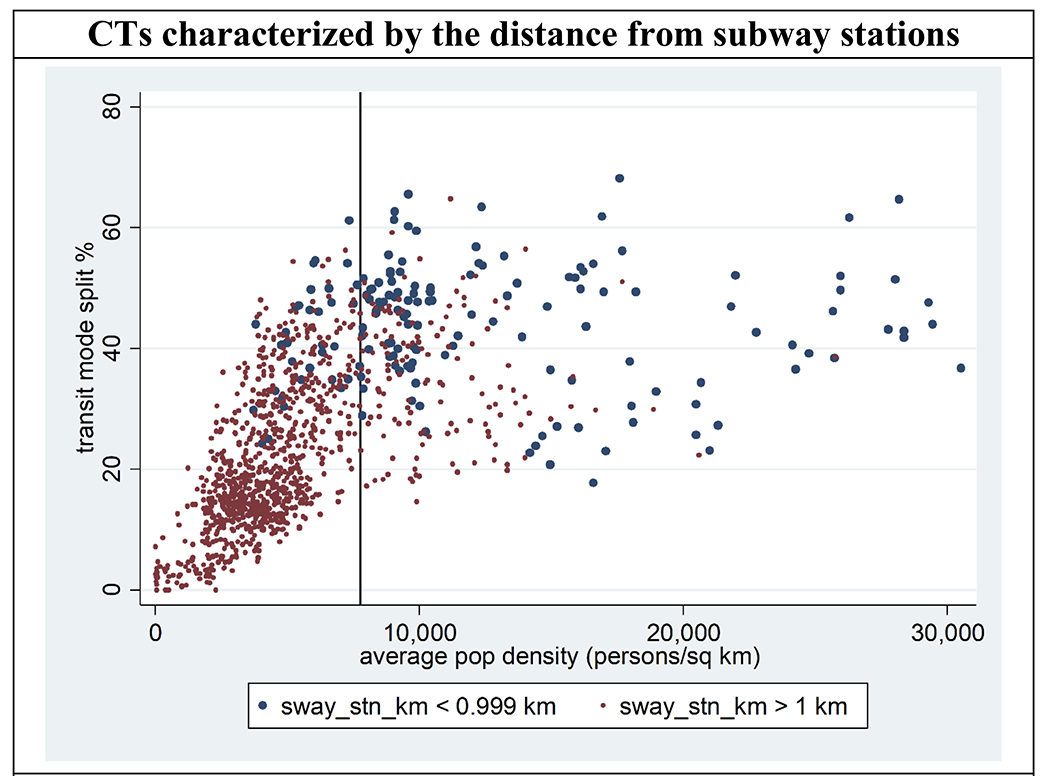
Figures 3A-B illustrate that higher population densities in Toronto occur near subway stations and downtown (blue dots). Also, an increase in densities in CTs near subway stations and downtowns does not result in even higher transit mode splits. The correlation between the two variables is more pronounced for tracts located farther from subway stations and downtown. Thus, increasing population densities in suburban neighborhoods (red dots) and improving service by surface transit would help avoid the pitfalls of diminishing returns, which are more pronounced near transit stations and in the urban core.

Table 3:Estimates of Transit + Walk + Bike Modes for Work Trips
Transit + Walk + Bike Toronto
Variables Coefficients
Density ≤ 9,385 (β1) 0.00534***
Density > 9,385 (β2) 0.00127***
Constant 2.79023***
Observations 1146
Adjusted R2 0.65
   
  Montreal
Variables Coefficients
Density ≤ 10,254 (β1) 0.00528***
Density > 10,254 (β2) 0.00375***
Constant 4.25763***
Observations 951
Adjusted R2 0.84
   
  Vancouver
Variables Coefficients
Density ≤ 8,767 (β1) 0.00474***
Density > 8,767 (β2) 0.00168***
Constant 5.66877***
Observations 472
Adjusted R2 0.66
*p < .05; **p < .01; ***p < .001.
Figure 2A
Figure 2A:Charting the Relationship between Population Density and Transit + Walk + Bike Mode Split in the Three Metropolitan Areas
Figure 2B
Figure 2B:Charting the Relationship between Population Density and Transit + Walk + Bike Mode Split in the Three Metropolitan Areas
Figure 2C
Figure 2C:Charting the Relationship between Population Density and Transit + Walk + Bike Mode Split in the Three Metropolitan Areas
Figure 3A
Figure 3A:Transit Mode Split and Proximity to Subway Stations and Downtown in Toronto
Figure 3B
Figure 3B:Transit Mode Split and Proximity to Subway Stations and Downtown in Toronto

ACKNOWLEDGMENTS

The author would like to express gratitude to Yemi Adediji, David Crowley, Liam Donaldson, Ahmed El-Geneidy, Bern Grush, Sumeet Gulati, and Stephen Wickens for their valuable feedback that has helped in improving the arguments advanced in this study. The author is grateful to anonymous referees for their suggestions. The author would also like to acknowledge the support of Caliper Corporation for providing the geocoded data for the 2016 Canadian population census. The nonlinear estimation routines were estimated in Stata with advice from Stata’s support team.

The author is solely responsible for all errors and omissions.

References

Cervero, R., and C. D. Kang. 2011. “Bus Rapid Transit Impacts on Land Uses and Land Values in Seoul, Korea.” Transport Policy 18 (1): 102–16. https://doi.org/10.1016/j.tranpol.2010.06.005.
Google Scholar
Cervero, R., and K. Kockelman. 1997. “Travel Demand and the 3Ds: Density, Diversity, and Design.” Transportation Research Part D: Transport and Environment 2 (3): 199–219. https://doi.org/10.1016/s1361-9209(97)00009-6.
Google Scholar
Chakraborty, A., and S. Mishra. 2013. “Land Use and Transit Ridership Connections: Implications for State-Level Planning Agencies.” Land Use Policy 30 (1): 458–69. https://doi.org/10.1016/j.landusepol.2012.04.017.
Google Scholar
Ewing, R., S. Hamidi, G. Tian, D. Proffitt, S Tonin, and L. Fregolent. 2018. “Testing Newman and Kenworthy’s Theory of Density and Automobile Dependence.” Journal of Planning Education and Research 38 (2): 167–82. https://doi.org/10.1177/0739456x16688767.
Google Scholar
Government of Ontario. 2017. “Places to Grow: Growth Plan for the Greater Golden Horseshoe, 2017.” http://www.placestogrow.ca/index.php?option=com_content&task=view&id=430&lang=eng.
Mankiw, N.G. 2014. Principles of Economics. 7th ed. Stamford, CT: Cengage Learning.
Google Scholar
Mitchell, M.N. 2012. Interpreting and Visualizing Regression Models Using Stata. College Station, TX: Stata Press. https://www.surveydesign.com.au/preview/ivrm-preview.pdf.
Google Scholar
Næss, P. 2015. “Built Environment, Causality and Travel.” Transport Reviews 35 (3): 275–91. https://doi.org/10.1080/01441647.2015.1017751.
Google Scholar
Newman, P. W. G., and J. R. Kenworthy. 1991. “Transport and Urban Form in Thirty‐two of the World’s Principal Cities.” Transport Reviews 11 (3): 249–72. https://doi.org/10.1080/01441649108716787.
Google Scholar
Polzin, S. E., X. Chu, and J. R. Rey. 2000. “Density and Captivity in Public Transit Success: Observations from the 1995 Nationwide Personal Transportation Study.” Transportation Research Record: Journal of the Transportation Research Board 1735 (1): 10–18. https://doi.org/10.3141/1735-02.
Google Scholar
Statistics Canada. 2012a. “Census Tract: Detailed Definition.” https://www150.statcan.gc.ca/n1/pub/92-195-x/2011001/geo/ct-sr/def-eng.htm.
———. 2012b. “CMA and CA: Detailed Definition.” https://www150.statcan.gc.ca/n1/pub/92-195-x/2011001/geo/cma-rmr/def-eng.htm.
———. 2017. “Focus on Geography Series, 2016 Census: Census Metropolitan Area of Toronto.” https://www12.statcan.gc.ca/census-recensement/2016/as-sa/fogs-spg/Facts-cma-eng.cfm?LANG=Eng&GK=CMA&GC=535&TOPIC=1.
Zhang, M., and N. Kukadia. 2005. “Metrics of Urban Form and the Modifiable Areal Unit Problem.” Transportation Research Record: Journal of the Transportation Research Board 1902 (1): 71–79. https://doi.org/10.1177/0361198105190200109.
Google Scholar

Powered by Scholastica, the modern academic journal management system