1. QUESTIONS
While travel demand models are calibrated to offer traffic forecasts for a single, “typical” weekday - and sometimes a typical weekend, actual travel varies substantially throughout the year. For example, Americans make approximately 5% more person-trips during spring and summer than in fall and winter (Huang, Kockelman, and Gurumurthy 2024). Similarly, 2001-2017 National Household Travel Survey (NHTS) data show Americans making 15-16% of person-trips on Fridays versus 12% on Sundays, as shown in Table 1 (FHWA 2023). The latest (2022) NHTS shows Saturdays carrying the most person-trips (15.6%) and, together with Friday, the most VKT (16.0%), suggesting a post-pandemic shift in Americans’ busiest day of travel.
Table 1.Percentages of Annual Person-Trips (PT) and VKT Occurring on Each Day-of-Week in NHTS
|
2022 |
2016/2017 |
2008/2009 |
2000/2001 |
| Day-of-week |
PTrips |
HH VKT |
PTrips |
HH VKT |
PTrips |
HH VKT |
PTrips |
HH VKT |
| Sunday |
11.7% |
12.3% |
12.4% |
12.2% |
12.2% |
11.3% |
12.8% |
11.7% |
| Monday |
14.4% |
15.8% |
14.1% |
13.9% |
14.2% |
15.0% |
13.9% |
14.1% |
| Tuesday |
14.4% |
13.4% |
14.5% |
13.6% |
14.8% |
14.1% |
14.0% |
14.1% |
| Wednesday |
14.7% |
12.4% |
14.8% |
14.4% |
14.8% |
15.2% |
14.7% |
15.3% |
| Thursday |
14.9% |
13.8% |
14.8% |
17.0% |
14.4% |
15.5% |
14.5% |
14.9% |
| Friday |
14.3% |
16.4% |
15.3% |
15.4% |
15.4% |
15.7% |
15.6% |
16.5% |
| Saturday |
15.6% |
16.0% |
14.1% |
13.7% |
14.3% |
13.3% |
14.6% |
13.5% |
| Sample size |
16,997
persons |
7,893
households |
264,234
persons |
129,696
households |
308,901
persons |
150,147
households |
160,758
persons |
69,817
households |
Note: All percentages are based on population-weighted values from each NHTS. PTrips = Person-trips, HH = Household.
Annual average daily traffic (AADT) estimates are used to inform infrastructure investments, validate travel demand models, evaluate road safety, and more (Gadda, Kockelman, and Magoon 2007; Selby and Kockelman 2013). AADT values come from PTR stations’ counts and short-period traffic counts (SPTC) from portable counters. SPTCs are adjusted using day-of-week and month-of-year factors from relevant PTRs. Several U.S. states, including Vermont, Pennsylvania, and Washington, have published recent average seasonal factors (VTrans 2023; PennDOT 2022; WSDOT 2020).
Travel modelers are beginning to assess the impacts of demand variations across wide networks. Huang, Kockelman, and Gurumurthy (2024) simulated shared autonomous vehicle fleets in Austin, Texas across four seasons for both weekdays and weekends using demand adjustment factors calculated from the 2017 NHTS. They found fleet performance differed significantly across seasons and days of the week. However, local demand patterns often deviate substantially from national averages. Moreover, due to the ever-shifting dynamics of travel, “big data”, such as probe vehicle data derived from measurements pervasively obtained from instrumented vehicles, may be better suited for this task than travel surveys. This paper explores two datasets for capturing regional demand variations to address the associated questions:
-
What are the advantages and disadvantages of each data source in capturing travel demand variations across the year?
-
What are notable variation patterns?
-
Are the apparent demand variations consistent across data sources?
2. METHODS
At least two datasets reveal how travel demand changes throughout the year in Texas. Nearly 400 PTRs track traffic counts using loop detectors embedded in Texas highway pavements. This conventional dataset differs greatly from the trip tables obtained from the Regional Integrated Transportation Information System (RITIS) Nextgen Trip Analytics interface (CATT Lab 2024). RITIS relies on INRIX’s probes: “connected vehicles” (with in-vehicle GPS systems) and “location-based services” data (from smartphone applications). StreetLight also offers probe vehicle-based data for every day of the year, but they are normalized using machine learning models trained on monthly PTR counts across the US (StreetLight 2022, 2023).
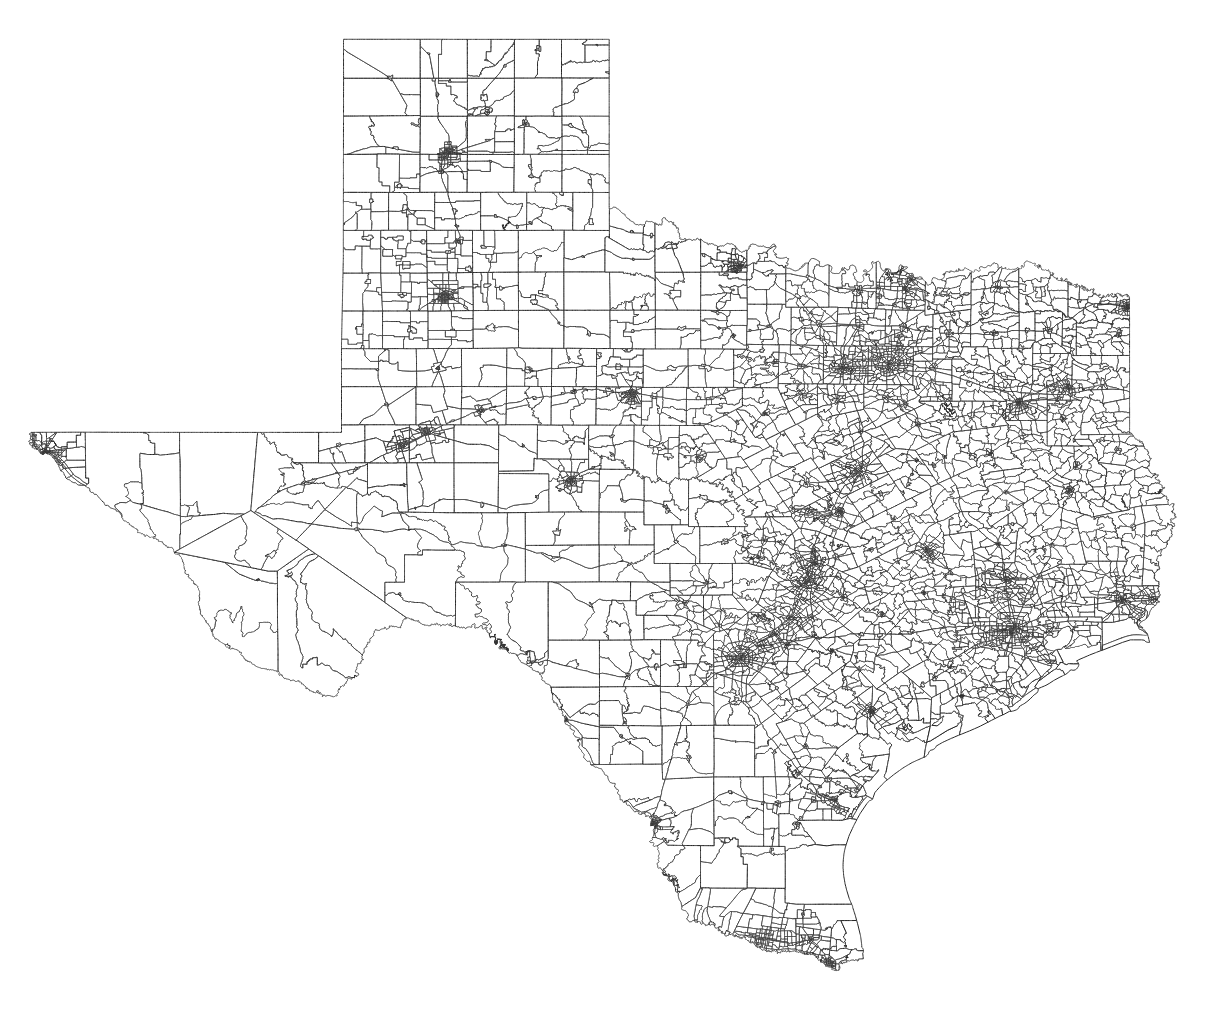
From 2013 through 2022, the Texas Department of Transportation (TxDOT) maintained 398 distinct PTR stations, mostly on highways (Figure 1). 74.9% of these stations are located on freeways and principal arterials, while TxDOT estimates that 61.6% of VMT from 2013 through 2022 come from roads of these functional classes (TxDOT 2023). 203 of these stations classify vehicles into 13 categories. The number of stations fluctuates day to day, as local receivers or loops trip off unexpectedly. Figure 2 shows the total light-duty vehicle (LDV) counts across 52 stations (out of the 203) that offer traffic counts for more than 90% of days in 2019 through 2022, after imputing for 4.1% missing values and outliers. The 4 years of demand patterns align well (with peaks on Fridays), excepting extraordinary events – like the COVID-19 pandemic and winter storms in 2021 and 2022.
__including_203_vehicle-class_count_stations_(righ.svg)
Figure 1.TxDOT’s 398 PTR Station Locations (left), including 203 Vehicle-class Count Stations (right)
Note: The 52 most reliable count stations are shown as red squares (right) and used for Figure 2 plots.

Figure 2.Total Daily LDV Traffic Counts across 52 PTR Stations from 2019 through 2022 (data shifted to correspond to the 2021 days of week)
RITIS’s processed probe vehicle data were purchased by TxDOT for the spring and fall months of 2021 (February through April and September through November) and 2022 (February through April and August through October). Probe vehicle trips were aggregated at the level of 6,860 Statewide Analysis Model (SAM) zones to generate daily trip tables. Figure 3 shows the daily LDV VKT approximated using shortest paths on the SAM network. Intrazonal trips were substantially overrepresented, comprising 26.7% of all trips, and were therefore not included in the VKT calculation. Unlike the PTR data, the INRIX/RITIS demands are inconsistent, and their oscillations are relatively irregular.

Figure 3.Total Daily LDV VKT in INRIX/RITIS 2021 and 2022 (data shifted to correspond to the 2021 days of week)
Log-linear ordinary least squares regression was used to evaluate and compare how demand variations can be explained in each dataset as follows:
\[\ln y_{i} = \mathbf{x}_{\mathbf{i}}^{\mathbf{T}}\mathbf{\beta} + \varepsilon_{i}\]
The marginal effects are expressed as ratio changes, allowing for comparisons of coefficient estimates between the two models. The PTR regression model for daily LDV traffic counts uses all data from 2013 through 2022 from 203 stations with counts by vehicle class. Fixed effects are used to reflect PTR-specific levels of demand and unobserved heterogeneity (Hedges 1994). Explanatory variables include days of the week, month, year, and select holidays (and days before/after). The model for state-level VKT controls only for days of week and months of year, due to the limited number of observations.
3. FINDINGS
Table 2 shows the PTR daily LDV count model results. On average (across sites), LDV counts vary by 27.5% across the week: falling 4.2% on Tuesdays (relative to the base day: Mondays) and rising 23.3% on Fridays (relative to Mondays). January is the least busy month, and June and July are the busiest (with counts roughly 14% above January’s). Counts rose year after year, excepting the notable drop in 2020 due to the COVID-19 pandemic (and recovery by 2022).
Table 2.PTR Daily LDV Traffic Count Fixed-Effect Log-Linear Regression Result
| Variable |
Estimate |
t-statistic |
Percentage effect |
| Constant |
7.779 |
3937.2*** |
- |
| Monday (base day) |
0 |
- |
- |
| Tuesday |
-0.042 |
-30.2*** |
-4.2% |
| Wednesday |
-0.032 |
-23.0*** |
-3.2% |
| Thursday |
0.035 |
24.8*** |
+3.6% |
| Friday |
0.209 |
147.2*** |
+23.3% |
| Saturday |
0.083 |
59.2*** |
+8.7% |
| Sunday |
0.019 |
13.5*** |
+1.9% |
| January (base month) |
0 |
- |
- |
| February |
0.013 |
7.2*** |
+1.3% |
| March |
0.120 |
66.7*** |
+12.8% |
| April |
0.058 |
31.9*** |
+5.9% |
| May |
0.103 |
56.2*** |
+10.8% |
| June |
0.127 |
69.6*** |
+13.5% |
| July |
0.131 |
71.5*** |
+14.0% |
| August |
0.096 |
53.1*** |
+10.0% |
| September |
0.066 |
36.0*** |
+6.8% |
| October |
0.100 |
55.8*** |
+10.5% |
| November |
0.094 |
49.1*** |
+9.9% |
| December |
0.118 |
63.3*** |
+12.5% |
| Year 2013 (base year) |
0 |
- |
- |
| Year 2014 |
0.053 |
31.3*** |
+5.4% |
| Year 2015 |
0.113 |
65.8*** |
+11.9% |
| Year 2016 |
0.138 |
77.8*** |
+14.8% |
| Year 2017 |
0.157 |
89.5*** |
+17.0% |
| Year 2018 |
0.181 |
102.9*** |
+19.8% |
| Year 2019 |
0.213 |
123.1*** |
+23.7% |
| Year 2020 |
0.048 |
27.7*** |
+5.0% |
| Year 2021 |
0.189 |
107.3*** |
+20.8% |
| Year 2022 |
0.218 |
123.1*** |
+24.4% |
| Friday before Memorial Day |
0.103 |
14.2*** |
+10.8% |
| Memorial Day |
0.060 |
8.2*** |
+6.2% |
| July 3 |
0.110 |
13.6*** |
+11.6% |
| Fourth of July |
-0.088 |
-12.1*** |
-8.4% |
| Friday before Labor Day |
0.137 |
19.1*** |
+14.7% |
| Labor Day |
0.144 |
19.9*** |
+15.5% |
| Tuesday before Thanksgiving |
0.267 |
36.7*** |
+30.6% |
| Day before Thanksgiving |
0.442 |
60.0*** |
+55.6% |
| Thanksgiving Day†
|
0.023 |
3.1** |
+2.3% |
| Day after Thanksgiving |
-0.050 |
-6.8*** |
-4.9% |
| Saturday after Thanksgiving |
0.119 |
16.4*** |
+12.6% |
| Sunday after Thanksgiving |
0.230 |
31.0*** |
+25.9% |
| December 23 |
0.198 |
27.0*** |
+21.9% |
| Christmas Eve (Dec. 24) |
0.061 |
8.2*** |
+6.3% |
| Christmas (Dec. 25) |
-0.183 |
-25.6*** |
-16.7% |
| December 26 |
0.129 |
16.3*** |
+13.7% |
| R-squared |
0.206 |
| #Observations |
n = 385,673 site-days |
| #Entities |
203 PTR sites |
*** for p < 0.001, ** for p < 0.01, and * for p < 0.05
† Thanksgiving is the third or fourth Thursday of November.
Final column contains percentage effect, which is exp(β)-1 or approximately β if β is close to 0.
Table 3 provides regression results for the INRIX/RITIS-based estimates of daily LDV VKT. Although fewer parameters are statistically significant in the INRIX/RITIS-based VKT estimates (and no month-of-year effects are evident), the day-of-week variations are mostly consistent between the two datasets (Table 3 vs Table 2 results), with daily LDV use appearing steady from Sunday through Thursday and rising roughly 20% on Fridays. However, the INRIX/RITIS data suggest a 17.4% rise in LDV flows on Saturdays, rather than the 8.7% rise indicated by the PTR data. Adding a separate Saturday indicator for the two INRIX/RITIS data years (2021 and 2022) to the PTR model (Table 2) led to an even lesser increase of 7.1%. This suggests that the difference may be due to higher vehicle (and mobile device) occupancies on Saturdays, since LBS data from multiple devices traveling together in the same vehicle were not deduplicated by INRIX in 2021 and 2022 (Ramnath 2024).
Table 3.INRIX/RITIS Daily LDV VKT (millions) Log-Linear Regression Result
| Variable |
Estimate |
t-statistic |
Percentage effect |
| Constant |
4.842 |
173.2*** |
- |
| Monday through Thursday + Sunday (base days) |
0 |
- |
- |
| Friday |
0.186 |
7.9*** |
+20.4% |
| Saturday |
0.160 |
6.7*** |
+17.3% |
| February 2021 |
-0.378 |
-9.5*** |
-31.5% |
| March 2021 (base month) |
0 |
- |
- |
| April 2021 |
0.000 |
0.0 |
+0.0% |
| September 2021 |
0.095 |
2.4* |
+10.0% |
| October 2021 |
0.120 |
3.1** |
+12.8% |
| November 2021 |
0.134 |
3.4*** |
+14.3% |
| February 2022 |
0.132 |
3.3** |
+14.1% |
| March 2022 |
0.293 |
7.5*** |
+34.1% |
| April 2022 |
0.280 |
7.1*** |
+32.3% |
| August 2022 |
0.053 |
1.4 |
+5.5% |
| September 2022 |
0.090 |
2.3* |
+9.4% |
| October 2022 |
-0.179 |
-4.6*** |
-16.4% |
| R-squared |
0.618 |
| Adj R-squared |
0.603 |
| #Observations |
n = 357 days’ trip tables |
*** for p < 0.001, ** for p < 0.01, and * for p < 0.05
Final column contains percentage effect, which is exp(β)-1 or approximately β if β is close to 0.
While INRIX’s big-data assembly should be able to out-perform traditional data sources in sensing day-to-day demand variations, these results suggest it is not yet the case. Apparently, INRIX’s sampling rates can and do vary dramatically: day to day and month to month (Figure 3).
These results are highly applicable across the US and beyond. Texas is the nation’s second largest state, in size and population, with a variety of regions and roadway types, and demographics that mimic most of the US. INRIX and PTR-type data are collected across the nation, via nearly identical installations, using standard tools and methods.
Although directly capturing statewide demand variations from trip tables was not possible, INRIX and RITIS offer tools for more local analyses, such as speeds and flows along specific corridors and to/from specific zones, essentially acting as virtual traffic recorders across vast regions. PTR sites are limited, heavily biased towards major roads (and therefore longer-distance trips), often offline/not working, and cannot exceed capacity, while vehicles head to less congested links during peak times of the year or capacity-lowering events. To make more sense of INRIX/RITIS values, INRIX’s evolving daily vehicle sampling rates are needed. INRIX is currently working on providing these sampling rates, as well as improving the quality of LBS data (Ramnath 2024). Time-series methods for both data types, plus spatial autocorrelation across count sites, are new methods to examine in subsequent works. Future research can also consider covariates like local population and jobs densities, number of lanes, speed limits, and more, for count predictions. Similarly, state-level variables like average rainfall and major events may improve VKT predictions across this large region.
ACKNOWLEDGEMENTS
The authors thank the Texas Department of Transportation for data access, the University of Maryland’s Center for Advanced Transportation Technology Laboratory staff for answering questions, undergraduate Connor Moening for data downloads, and Aditi Bhaskar for her editing (and administrative) support.
Missing values and values over 5 standard deviations away from the mean in 2019, 2021, and 2022 were imputed as the average for the day of the week for the same month over the 3 years. However, counts from February 13-17, 2021, and February 3, 2022, were kept because the cause can be identified as winter storms Uri and Landon descending on Texas. For 2020, missing values were imputed using the same method but averaged using data from just 2020. 3,091 values (4.1%) were imputed out of 75,672 total data points used to derive Figure 2. For the PTR regressions, values over 5 standard deviations away from the mean (from 2013 through 2022 but excepting 2020 and dates mentioned above) were removed but no values were imputed.
Statewide Analysis Model Traffic Analysis Zones
Figure 4 shows the 6,860 traffic analysis zones (TAZs) used in the Texas Statewide Analysis Model (SAM). Trips in the INRIX/RITIS database were aggregated at the level of these TAZs to construct the daily trip tables used in this study. This was done directly on the RITIS platform by uploading the GeoJSON file of the TAZs.

Figure 4.Map of 6,860 TAZs in SAM used to aggregate INRIX/RITIS trips
Additional Regression Results
Although log-linear regression was used for both PTRs and INRIX/RITIS datasets to compare day of week, month of year, and holiday effects between the two differing measures of travel demand, unique models for each dataset were also explored. Table 4 shows the regression results of the daily LDV and total traffic counts at each PTR station standardized to z-scores using the mean and standard deviation at the station over the 10 years. The LDV count z-score model has a slightly higher R-squared value of 0.234 compared to 0.206 in the log-linear model presented in Table 2, and there are no large differences in the statistically significant variables. The model of total traffic counts at all 398 stations reveals some differences in traffic count variations (by day of week, month of year, and holidays) when predicting total traffic counts (at 398 stations) vs just LDV counts (at 203 stations). For example, although LDV counts on Saturdays and Sundays are higher than that of Mondays, the total counts decrease on those days. Similarly, many days around holidays see increased LDV traffic but lower total traffic. This is because heavier commercial vehicles have demand patterns that are distinct from LDVs. Additionally, the R-squared value of the total traffic count model is substantially higher than the LDV count models, likely due to the elimination of the uncertainties surrounding vehicle type inference.
Table 4.PTR Daily LDV and Total Traffic Count Z-Score Regression Results
|
Y = LDV count |
Y = Total count |
| Variable |
Estimate |
t-statistic |
Estimate |
t-statistic |
| Constant |
-0.925 |
-131.6*** |
-0.977 |
-236.7*** |
| Monday (base day) |
0 |
- |
0 |
- |
| Tuesday |
-0.105 |
-20.3*** |
0.001 |
0.4 |
| Wednesday |
-0.061 |
-11.9*** |
0.087 |
29.1*** |
| Thursday |
0.180 |
34.8*** |
0.287 |
96.7*** |
| Friday |
0.917 |
176.3*** |
0.868 |
290.8*** |
| Saturday |
0.305 |
58.9*** |
-0.192 |
-64.8*** |
| Sunday |
-0.033 |
-6.3*** |
-0.764 |
-256.3*** |
| January (base month) |
0 |
- |
0 |
- |
| February |
0.127 |
18.9*** |
0.182 |
47.0*** |
| March |
0.490 |
74.3*** |
0.511 |
134.8*** |
| April |
0.281 |
42.7*** |
0.343 |
90.6*** |
| May |
0.410 |
61.5*** |
0.472 |
122.8*** |
| June |
0.472 |
71.2*** |
0.582 |
153.1*** |
| July |
0.471 |
70.5*** |
0.550 |
144.0*** |
| August |
0.355 |
54.1*** |
0.481 |
127.4*** |
| September |
0.265 |
39.8*** |
0.416 |
108.2*** |
| October |
0.395 |
60.9*** |
0.512 |
136.7*** |
| November |
0.377 |
54.1*** |
0.499 |
124.4*** |
| December |
0.475 |
70.1*** |
0.450 |
115.3*** |
| Year 2013 (base year) |
0 |
- |
0 |
- |
| Year 2014 |
0.147 |
24.7*** |
0.154 |
43.9*** |
| Year 2015 |
0.340 |
57.5*** |
0.361 |
102.3*** |
| Year 2016 |
0.437 |
72.1*** |
0.517 |
148.1*** |
| Year 2017 |
0.481 |
80.3*** |
0.630 |
181.1*** |
| Year 2018 |
0.543 |
91.2*** |
0.728 |
210.3*** |
| Year 2019 |
0.666 |
113.8*** |
0.869 |
250.2*** |
| Year 2020 |
0.039 |
6.6*** |
0.225 |
64.0*** |
| Year 2021 |
0.559 |
94.7*** |
0.829 |
237.6*** |
| Year 2022 |
0.694 |
116.8*** |
0.915 |
263.0*** |
| Federal holiday†
|
-0.028 |
-2.6** |
-0.293 |
-47.7*** |
| Friday before Memorial Day |
0.497 |
18.8 |
0.431 |
28.1*** |
| Memorial Day |
0.120 |
4.2*** |
-0.314 |
-19.0*** |
| July 3 |
0.495 |
16.7*** |
0.303 |
18.1*** |
| Fourth of July |
-0.379 |
-13.3*** |
-0.762 |
-46.5*** |
| Friday before Labor Day |
0.651 |
24.9*** |
0.546 |
36.2*** |
| Labor Day |
0.465 |
16.6*** |
-0.081 |
-5.0*** |
| Tuesday before Thanksgiving |
1.002 |
38.0*** |
0.696 |
45.5*** |
| Day before Thanksgiving |
1.951 |
72.9*** |
1.315 |
85.4*** |
| Thanksgiving Day†
|
-0.040 |
-1.4 |
-1.089 |
-66.1*** |
| Day after Thanksgiving |
-0.340 |
-12.8*** |
-1.181 |
-76.7*** |
| Saturday after Thanksgiving |
0.473 |
17.9*** |
-0.080 |
-5.2*** |
| Sunday after Thanksgiving |
1.127 |
41.8*** |
0.841 |
54.4*** |
| December 23 |
0.818 |
30.6*** |
0.364 |
23.5*** |
| Christmas Eve (Dec. 24) |
0.138 |
5.1*** |
-0.692 |
-43.2*** |
| Christmas (Dec. 25) |
-0.848 |
-30.3*** |
-1.644 |
-100.9*** |
| December 26 |
0.405 |
14.1*** |
-0.205 |
-12.1*** |
| R-squared |
0.234 |
0.369 |
| Adj R-squared |
0.234 |
0.369 |
| #Observations |
n = 385,673
(203 PTR sites) |
n = 1,016,661
(398 PTR sites) |
*** for p < 0.001, ** for p < 0.01, and * for p < 0.05
† Federal holidays include New Year’s Day, MLK Day, Presidents’ Day, Memorial Day, Independence Day, Labor Day, Veterans Day, Thanksgiving, and Christmas. Thanksgiving is the third or fourth Thursday of November.
Table 5 provides the best linear regression results for the INRIX/RITIS-based estimates of daily LDV VKT. Compared to the log-linear model presented in Table 3, the day-of-week variable for Thursday emerged as statistically significant, and the goodness-of-fit is slightly better (adjusted R-squared of 0.697 vs 0.603).
Table 5.INRIX/RITIS Daily LDV VKT (millions) Linear Regression Result
| Variable |
Estimate |
t-statistic |
| Constant |
126.62 |
41.9*** |
Monday through Wednesday
+ Sunday (base days) |
0 |
- |
| Thursday |
5.14 |
2.0* |
| Friday |
28.23 |
11.0*** |
| Saturday |
23.43 |
9.0*** |
| February 2021 |
-37.39 |
-8.7*** |
| March 2021 (base month) |
0 |
- |
| April 2021 |
-0.64 |
-0.2 |
| September 2021 |
13.11 |
3.1** |
| October 2021 |
16.59 |
4.0*** |
| November 2021 |
19.07 |
4.5*** |
| February 2022 |
20.17 |
4.7*** |
| March 2022 |
44.54 |
10.7*** |
| April 2022 |
42.74 |
10.1*** |
| August 2022 |
6.05 |
1.5 |
| September 2022 |
11.33 |
2.7** |
| October 2022 |
-22.91 |
-5.5*** |
| R-squared |
0.709 |
| Adj R-squared |
0.697 |
| #Observations |
n = 357 days’ trip tables |
*** for p < 0.001, ** for p < 0.01, and * for p < 0.05
The R-squared values of the log-linear regressions are not substantially lower than those of the models tailored to the individual datasets. Therefore, this paper focuses on the comparison of the log-linear regression results.
In addition to the regression results presented in Tables 2 and 3, Table 6 shows the log-linear regression results for both PTRs and INRIX/RITIS using identical variables and the same date range of data. The same patterns can be observed here, with day-of-week effects being similar from Sunday through Friday but differing greatly between the two datasets for Saturday. Furthermore, month and year interaction effects (with March 2021 as the base) were similar for February 2021 and April 2021 but diverges past September 2021. This suggests that month-of-year effects can likely also be estimated from the INRIX/RITIS data if one can control for the sampling rate.
Table 6.PTR Daily LDV Traffic Count and INRIX/RITIS Daily LDV VKT (millions) Log-Linear Regression Results Using Identical Variables
|
PTR LDV |
INRIX/RITIS LDV |
| Variable |
Estimate |
t-statistic |
% effect |
Estimate |
t-statistic |
% effect |
| Constant |
7.966 |
1592.9*** |
- |
4.820 |
142.6*** |
- |
| Monday (base day) |
0 |
- |
- |
0 |
- |
- |
| Tuesday |
-0.029 |
-6.5*** |
-2.8% |
0.015 |
0.5 |
1.5% |
| Wednesday |
-0.026 |
-5.8*** |
-2.5% |
0.019 |
0.6 |
1.9% |
| Thursday |
0.025 |
5.7*** |
2.6% |
0.052 |
1.7 |
5.4% |
| Friday |
0.201 |
45.4*** |
22.2% |
0.209 |
6.9*** |
23.2% |
| Saturday |
0.081 |
18.3*** |
8.5% |
0.183 |
6.0*** |
20.1% |
| Sunday |
0.008 |
1.8 |
0.8% |
0.029 |
0.9 |
2.9% |
| February 2021 |
-0.383 |
-63.8*** |
-31.8% |
-0.379 |
-9.5*** |
-31.6% |
| March 2021 (base month) |
0 |
- |
- |
0 |
- |
- |
| April 2021 |
-0.015 |
-2.5* |
-1.4% |
-0.002 |
0.0 |
-0.2% |
| September 2021 |
-0.056 |
-9.7*** |
-5.5% |
0.093 |
2.4* |
9.8% |
| October 2021 |
-0.013 |
-2.3* |
-1.3% |
0.119 |
3.0** |
12.6% |
| November 2021 |
0.021 |
3.7*** |
2.2% |
0.134 |
3.4*** |
14.3% |
| February 2022 |
-0.133 |
-22.0*** |
-12.5% |
0.131 |
3.3** |
14.0% |
| March 2022 |
0.025 |
4.3*** |
2.6% |
0.292 |
7.5*** |
33.8% |
| April 2022 |
0.005 |
0.9 |
0.5% |
0.279 |
7.0*** |
32.2% |
| August 2022 |
-0.042 |
-7.3*** |
-4.1% |
0.053 |
1.4 |
5.5% |
| September 2022 |
-0.018 |
-3.1** |
-1.8% |
0.088 |
2.2* |
9.2% |
| October 2022 |
0.008 |
1.4 |
0.8% |
-0.180 |
-4.6*** |
-16.5% |
| R-squared |
0.230 |
0.621 |
| Adj R-squared |
- |
0.602 |
| #Observations |
n = 38,128 site-days |
n = 357 days’ trip tables |
| #Entities |
132 PTR sites |
- |
*** for p < 0.001, ** for p < 0.01, and * for p < 0.05
Final column contains percentage effect, which is exp(β)-1 or approximately β if β is close to 0.